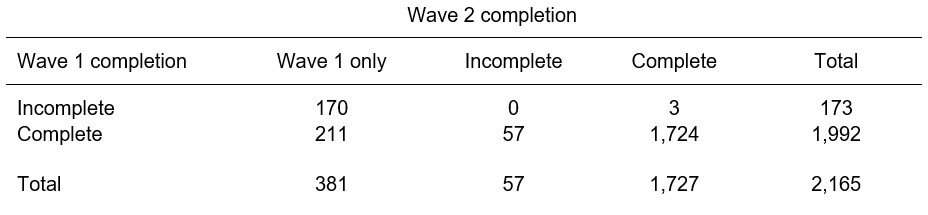
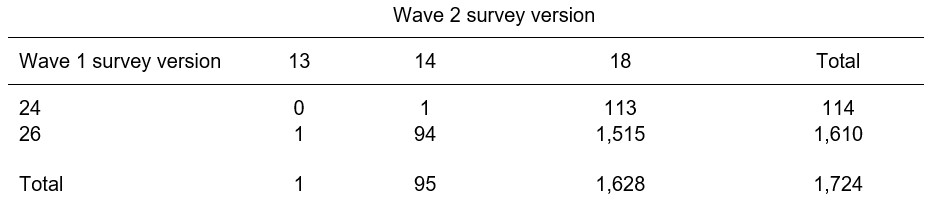
Prior to conducting substantive analysis of the survey data, they need to be processed and checked for signs of hurried or unthinking answers (which we refer to as satisficing).[1] The data from the two waves of the survey contained answers from 2,165 respondents before any processing was done. However, as Table 1 shows, these included answers from respondents who did not complete Wave 1 (173, of which 3 went on to complete Wave 2), completed Wave 1 but not Wave 2 (57), or completed Wave 1 but did not start Wave 2 (211). Removing those 441[2] respondents* from the data left 1,724, of which 209 had completed test versions of one or both waves of the survey, as Table 2 shows.
Those cases were also removed, leaving 1,515 cases to analyse for signs of satisficing, which were looked for in two ways. First, 7 grid questions were identified (5 from Wave 1, 2 from Wave 2) in which respondents could ‘straightline’ (i.e. pick the same answer option all the way down the grid) and a summary variable was created indicating the number of grids in which they had done so. Second, the distribution of completion times in each wave was graphed with histograms, and variables were created indicating respondents who had completed each wave in under 10 minutes and in under 6 minutes.

Figure 1 shows how many respondents straightlined each number of grid questions, with the vast majority (94.7%) doing so on 0, 1 or 2 such questions. There is a balance to be struck between the risk of analysing answers stemming from satisficing and the risk of deleting valid data. It seems plausible that respondents could give the same answers to all items in a grid (e.g. if they very rarely undertake any cultural activities, or frequently engage in all of the political acts asked about) for 1 or 2 question so, with sustaining the sample size in mind, respondents who straightlined 3 or more grid questions were identified for removal. Before doing so, however, completion times were also considered.
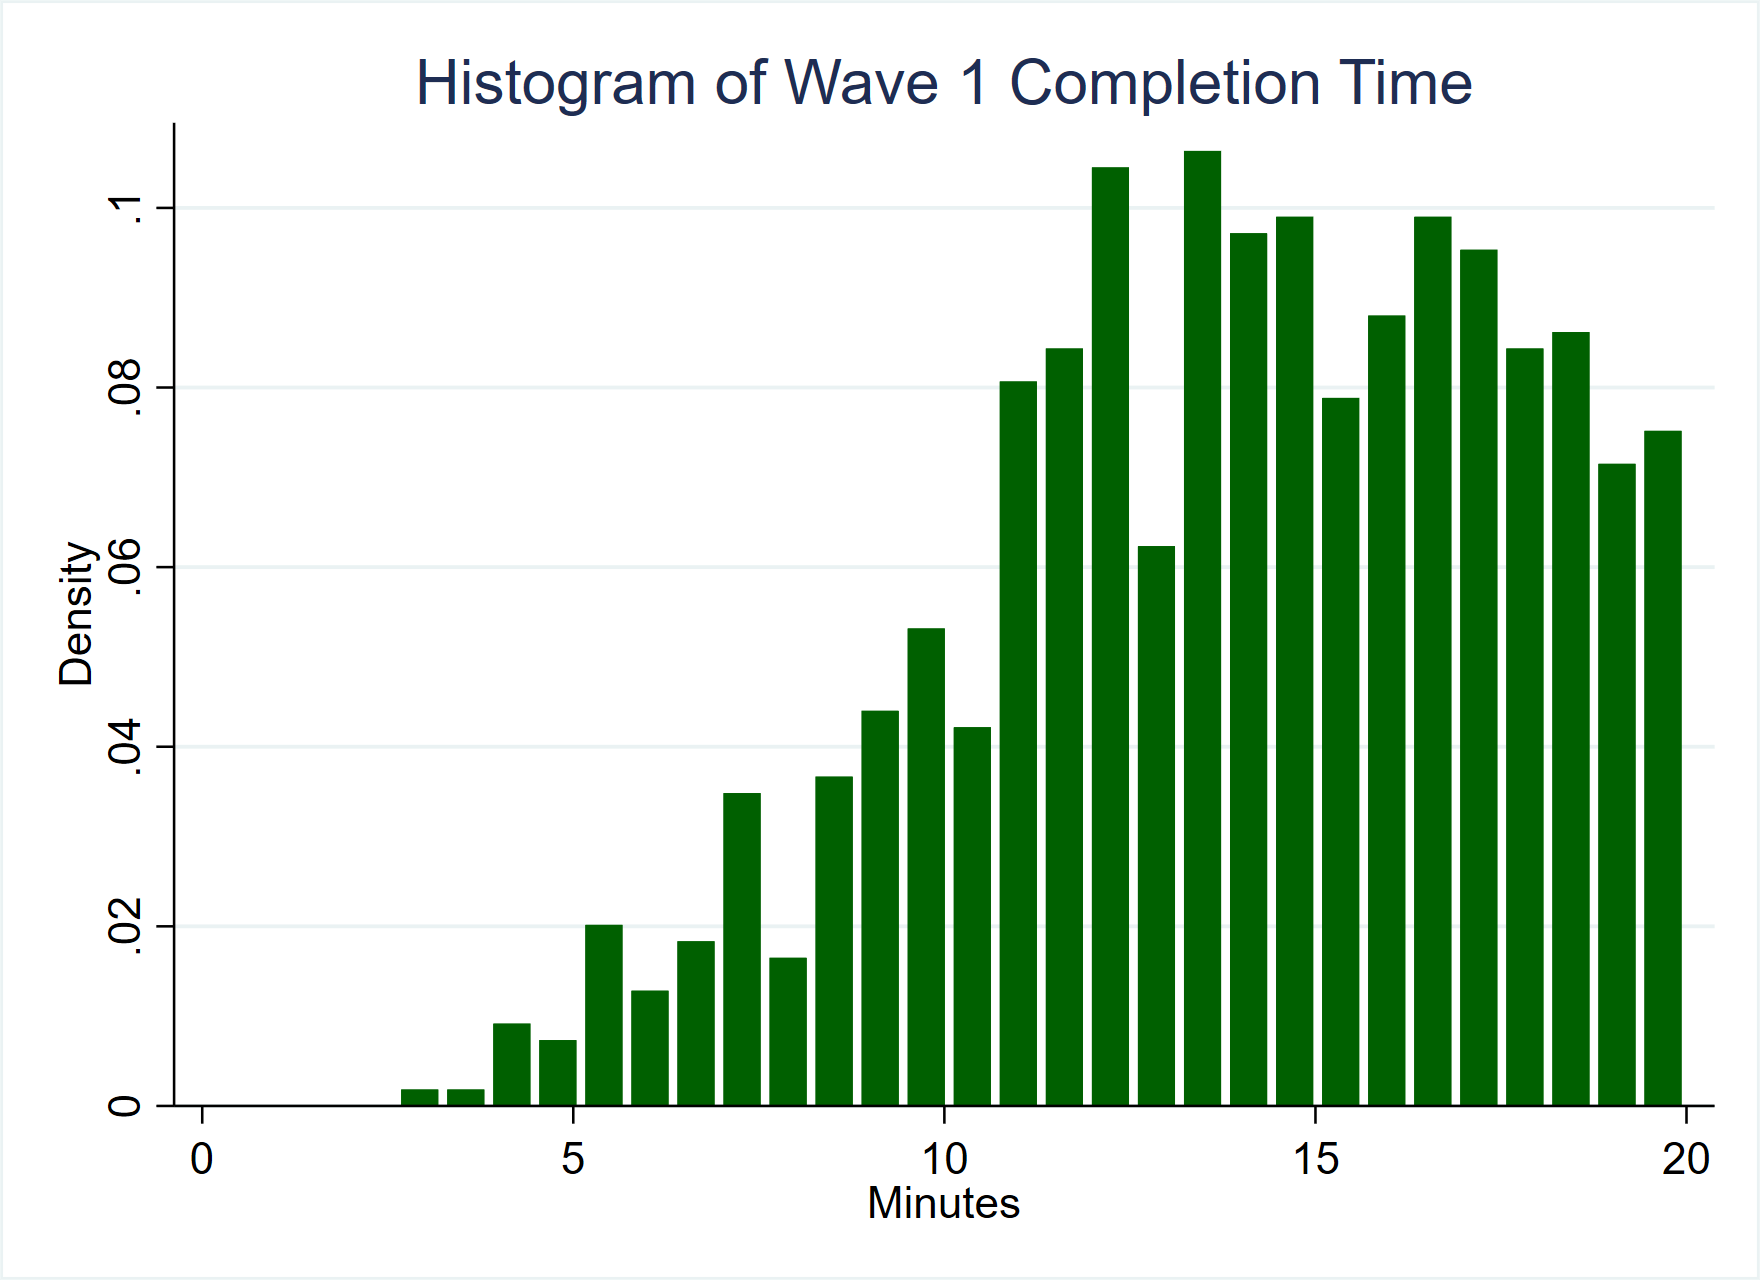
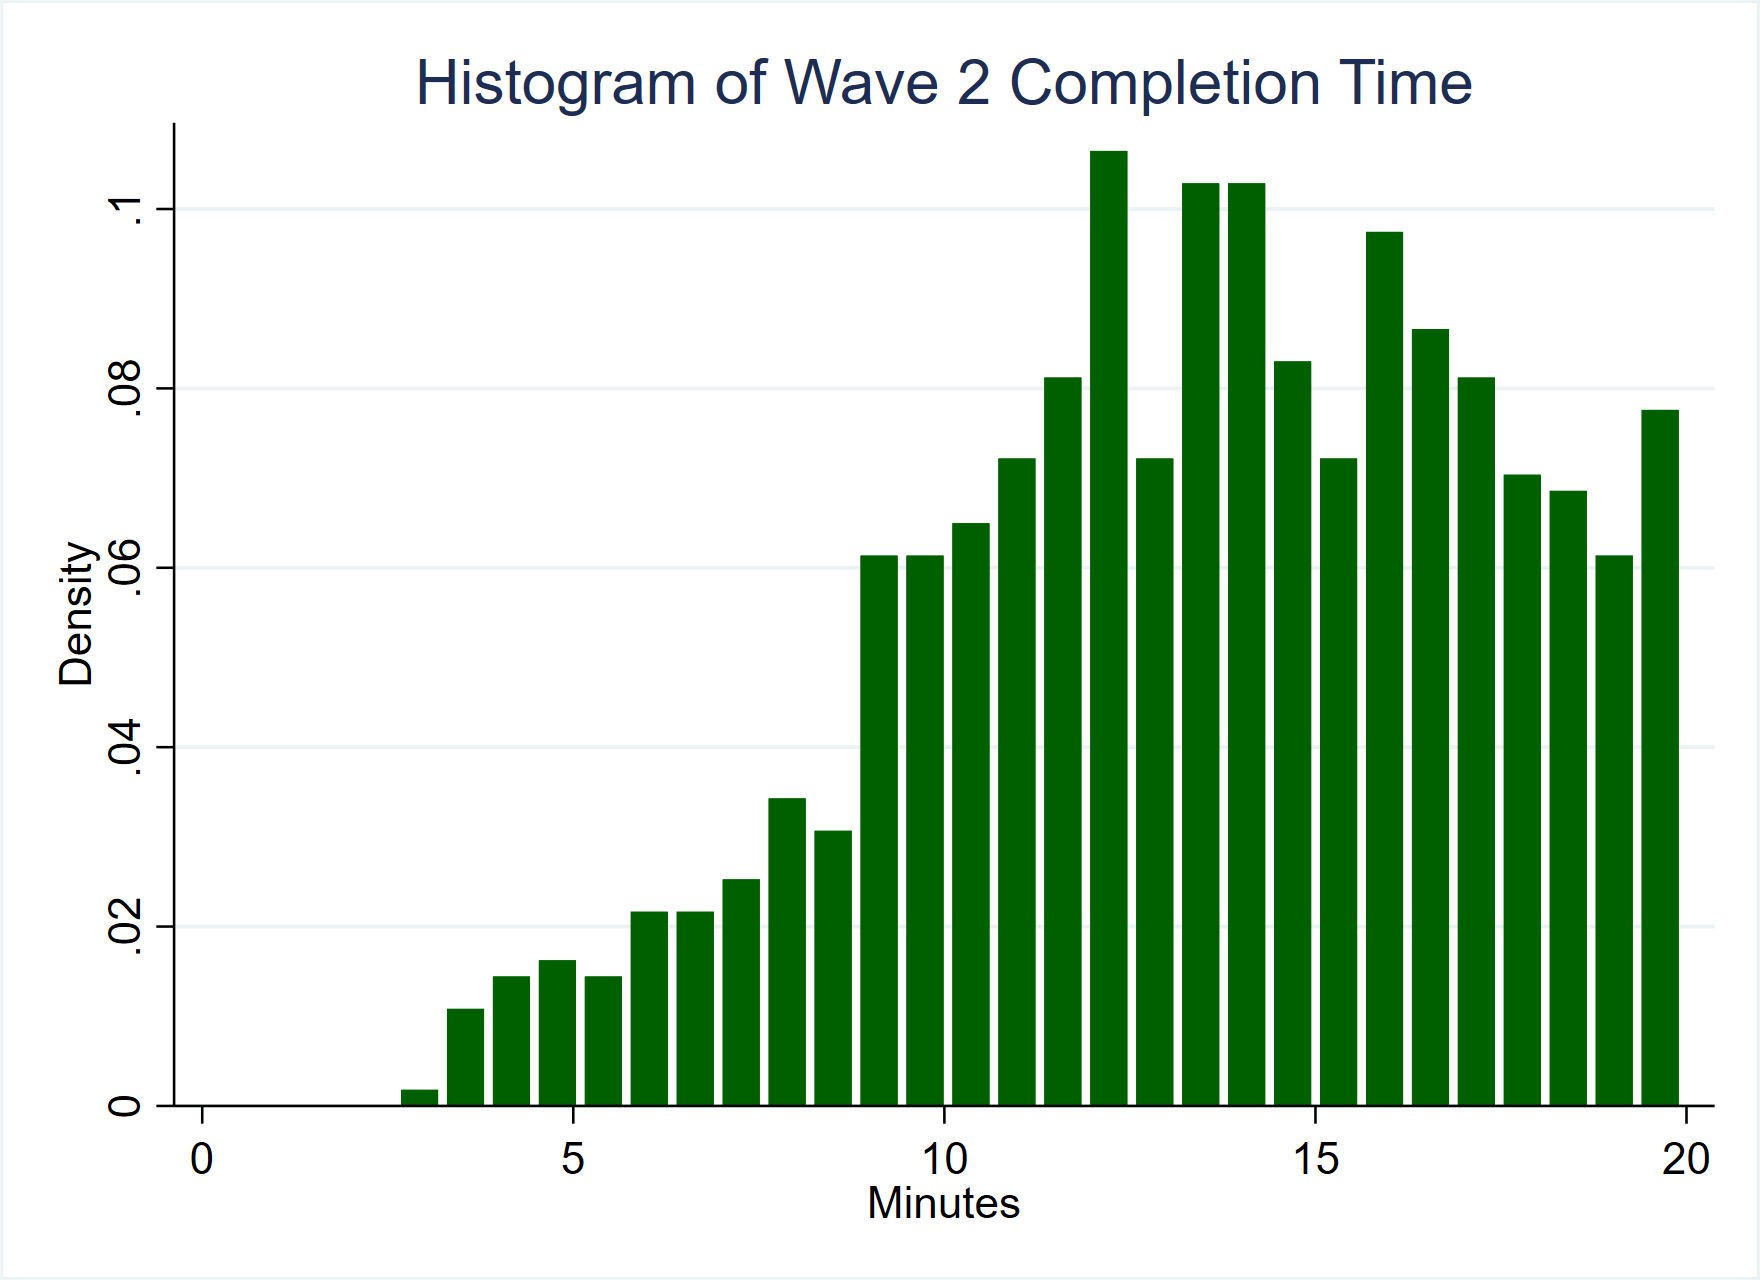
Figures 2 and 3 show histograms of the distribution of completion times for waves 1 and 2 respectively. The median completion time for Wave 1 was just over 18 minutes, and for Wave 2 just under 18 minutes. We are concerned with respondents speed through the survey, compromising the quality of their answers, so respondents who took more than 20 minutes to complete the survey are excluded from each histogram. These exclusions are additionally helpful because YouGov respondents can start a survey then go away and come back to it later. Given that completion time is calculated by deducting the start date and time from the end date and time, those respondents who complete a survey a few days after they began it are indicated to have taken thousands of minutes (when, in fact, they were away from their computer or phone for most of it). Graphing those respondents limits our ability to focus on the ones we are concerned with, who speed through.
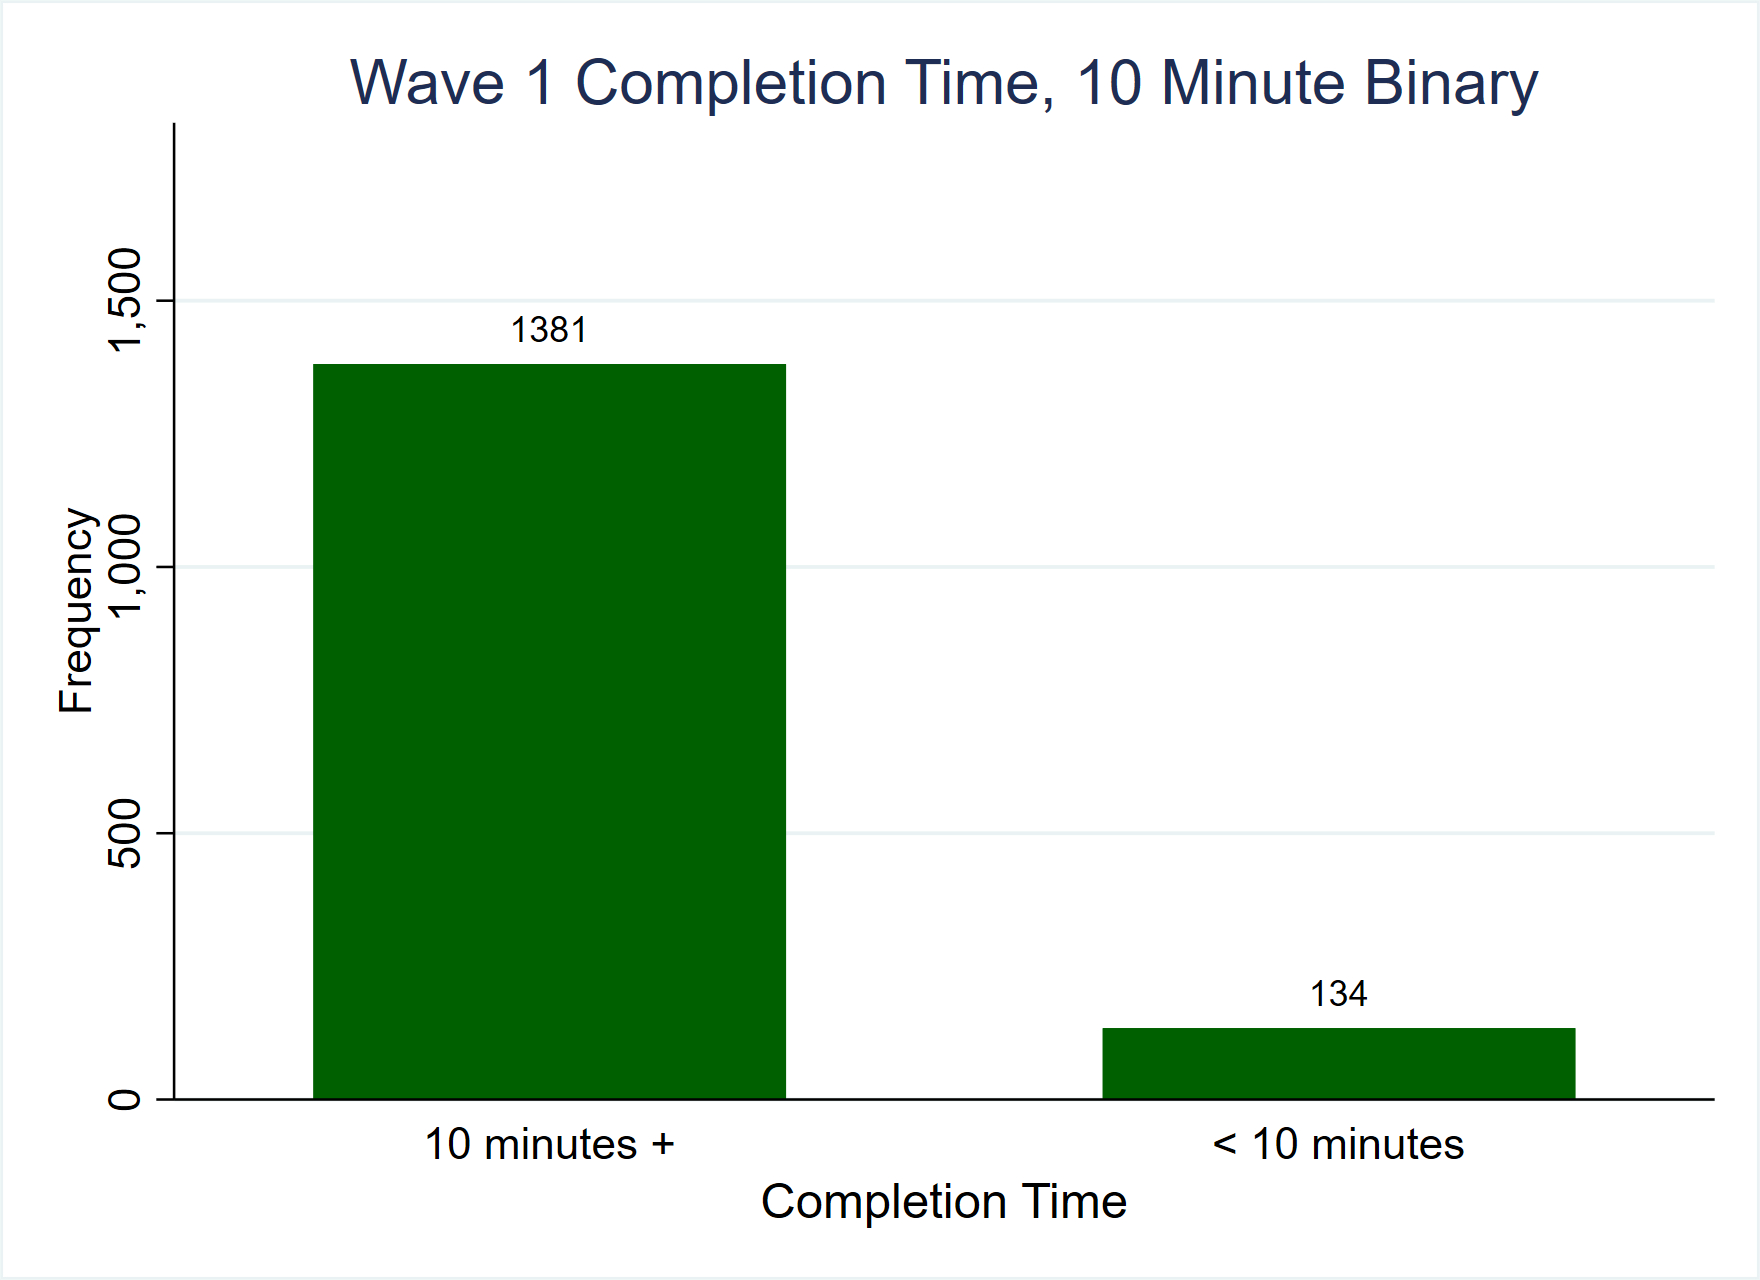
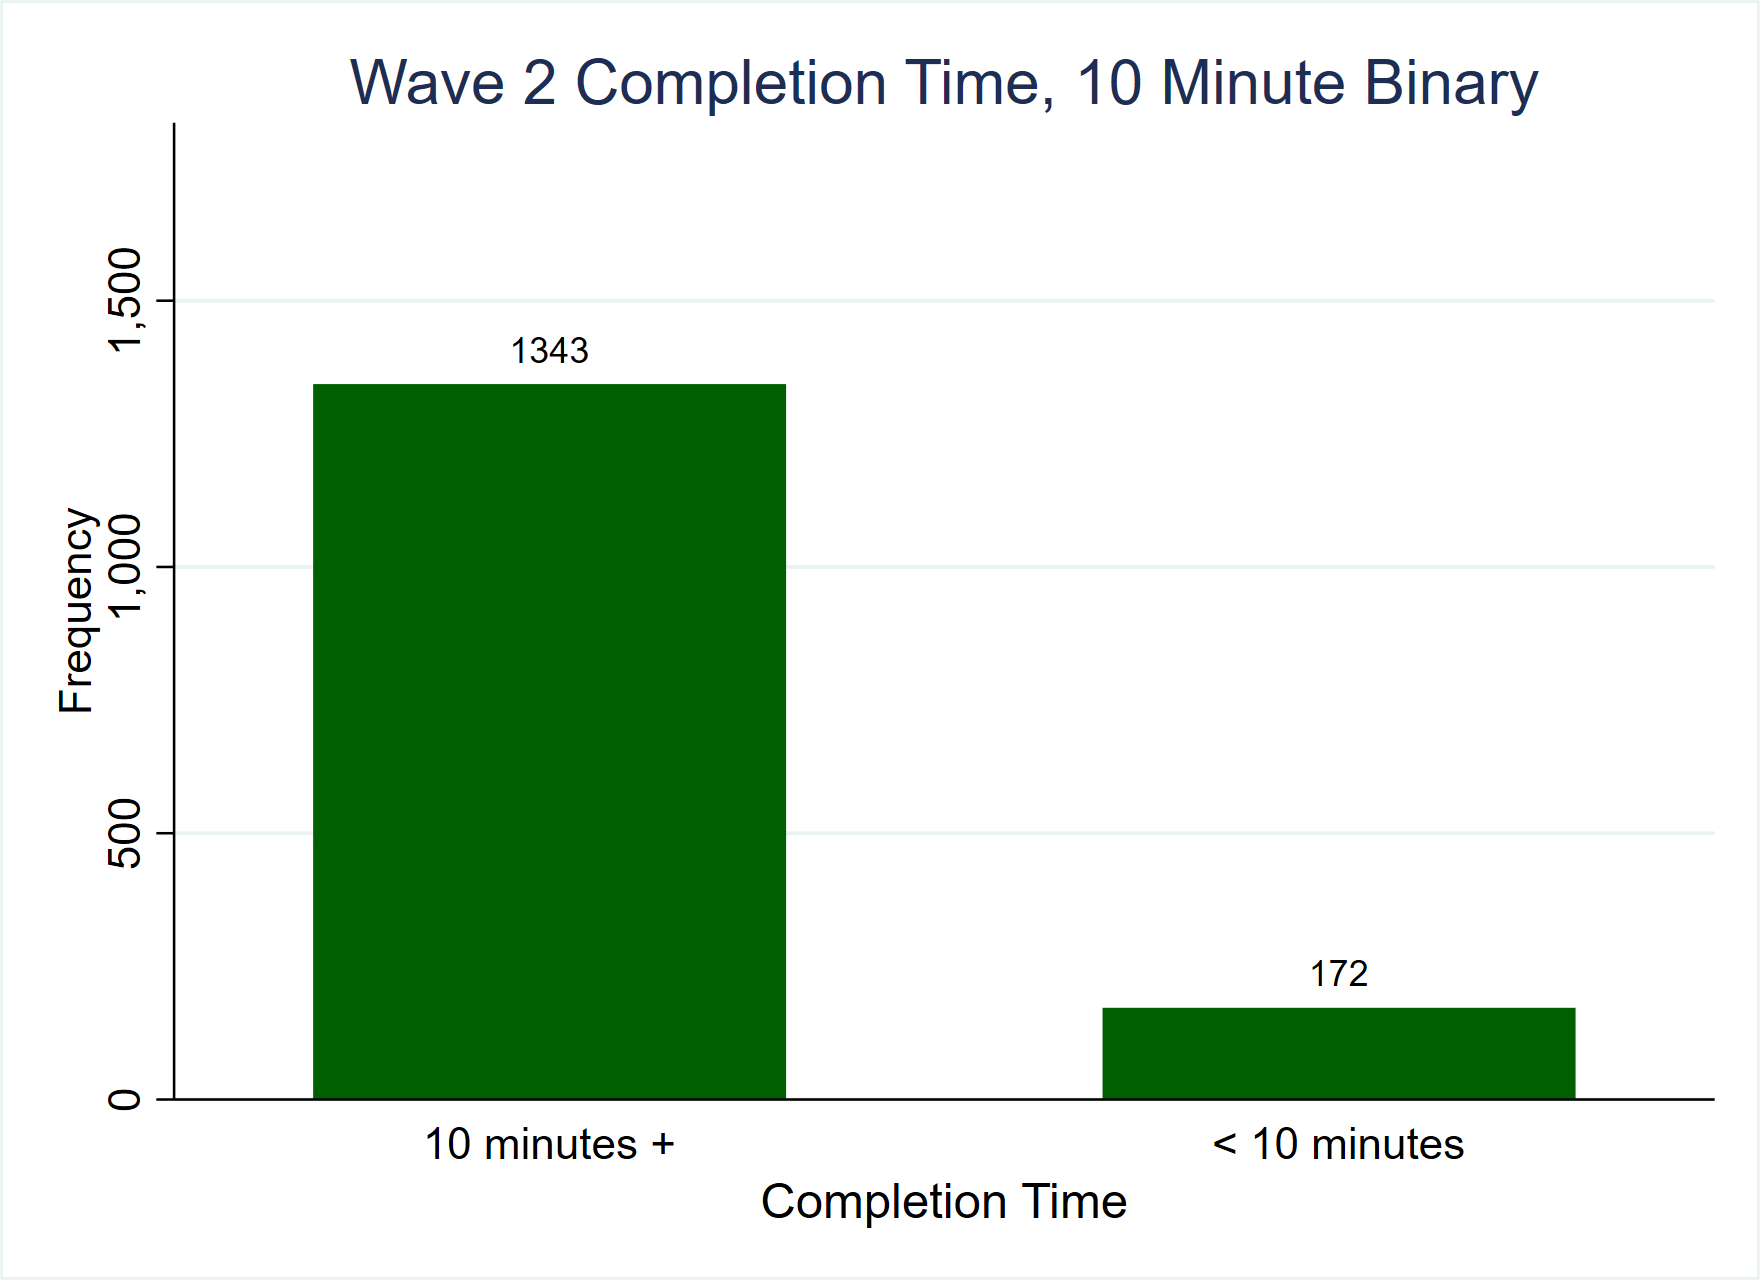
Figures 2 and 3 show that the bulk of respondents took 10 minutes or more to complete each wave. Two binary variables indicating respondents who took less than 10 minutes to complete each wave were created and figures 4 and 5 graph those variables. Just under 9% of respondents completed the Wave 1 survey in less than 10 minutes, whilst slightly more than 11% did so for the Wave 2 survey. Of the 218 respondents who completed either wave in less than 10 minutes, 88 did so for both. These figures are quite high (218 respondents represents more than 14% of the sample) so further binary variables were calculated to indicate respondents who completed each wave in less than 6 minutes (i.e. one third of the median completion time).

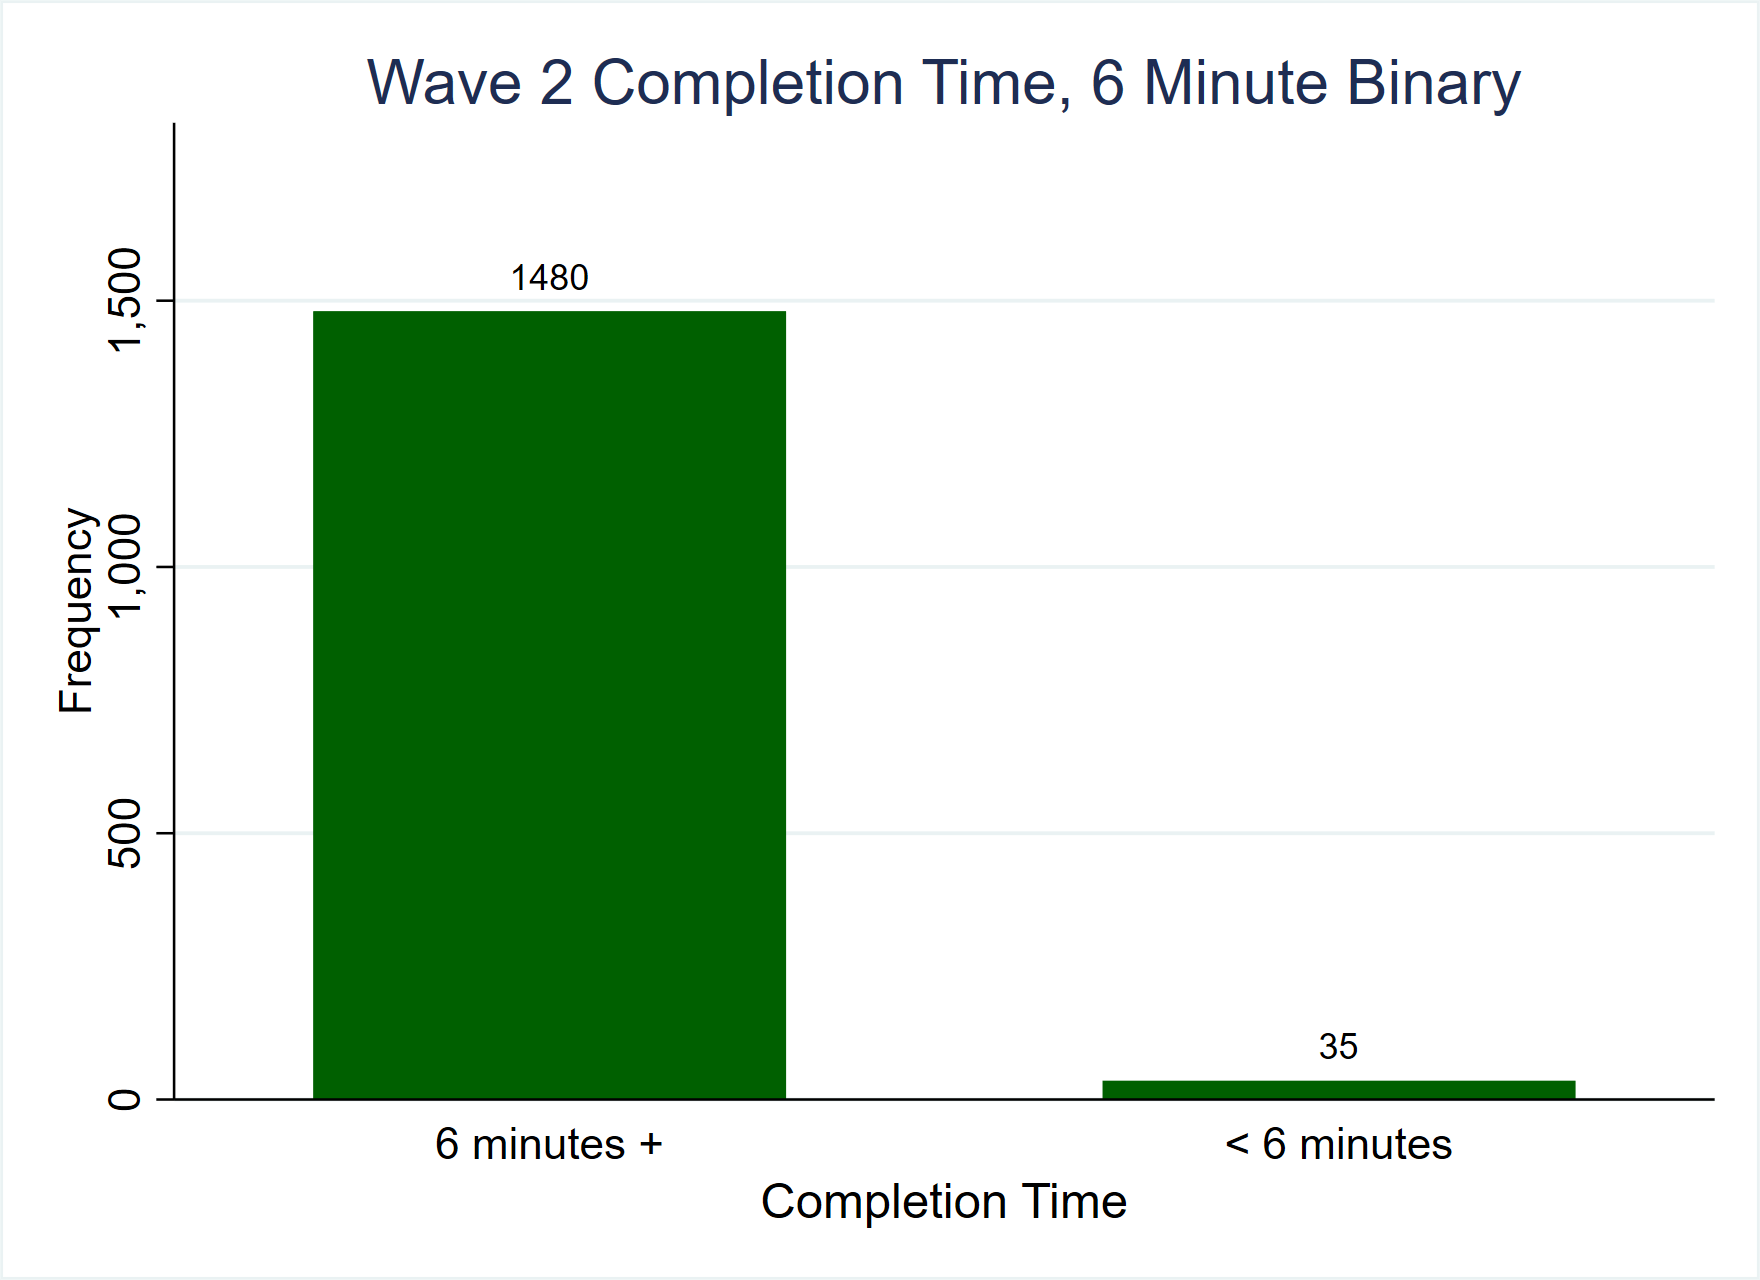
Figures 6 and 7 show the number of respondents who completed each wave in less than 6 minutes, with just under 2% doing so for Wave 1 and just over 2% doing so for Wave 2. Of the 48 respondents (3% of the sample) who completed either wave in less than 6 minutes, 13 did for both. With preservation of sample size in mind, respondents who completed either wave in less than 6 minutes were identified for removal. Table 3 crosstabulates the variable indicating low completion times for the survey waves with the variable indicating the number of respondents who straghtlined each number of grid questions. As noted before, those respondents who straightlined 3 or more questions, and those who completed either wave in less than 6 minutes were removed. Such respondents numbered 98 (around 6.5% of the sample), meaning that 1,407 respondents were retained. They can be seen in the top three rows of the left-hand column of the table.

After the removal of respondents who did not complete one of the waves, completed a test version of either of the surveys, or showed significant signs of satisficing, YouGov ran their standard weighting procedure on the remaining respondents. During that process, 2 respondents were identified who did not have complete data for 1 or more of the variables used in weighting. Those respondents were removed from the data so the final weighted sample includes answers from 1,405 respondents.
[1] Satisficing indicates that respondents expend the minimum effort to give satisfactory answers, rather than expending the effort to give optimal answers, which we call optimising.
[2] This number included three duplicate cases.

One thought on “Survey Satisficing”