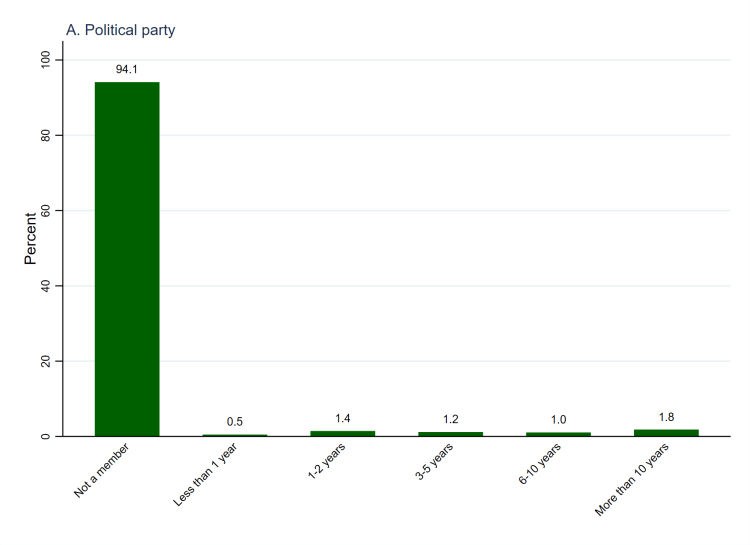
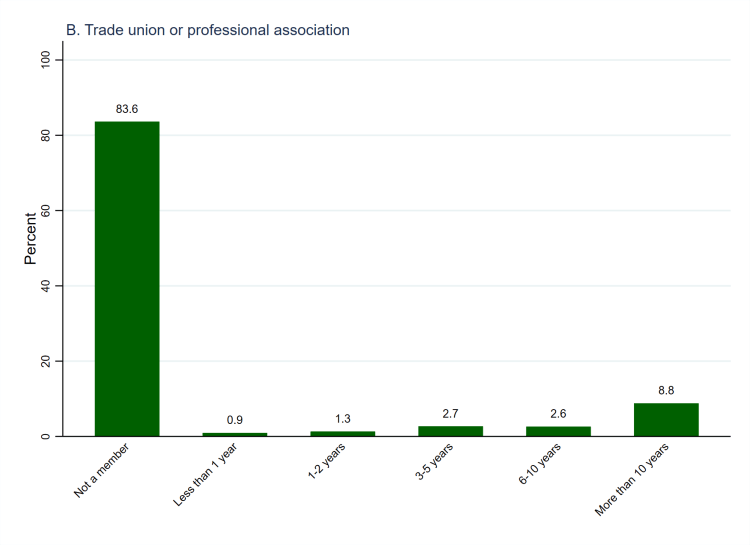
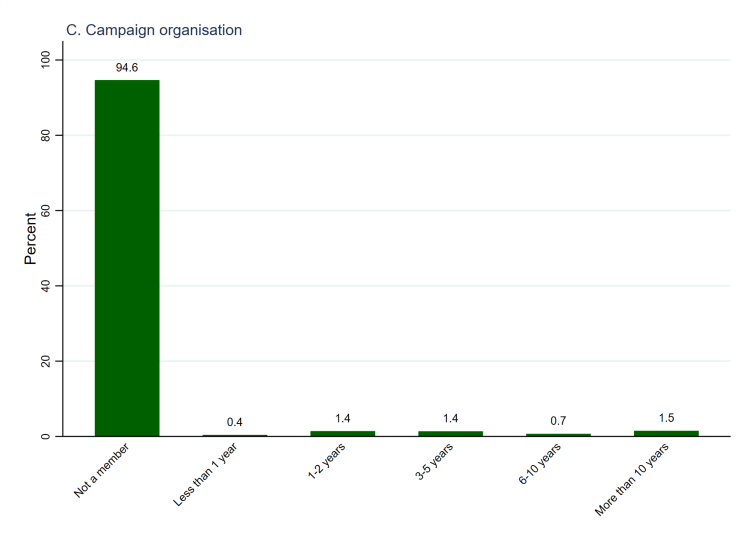
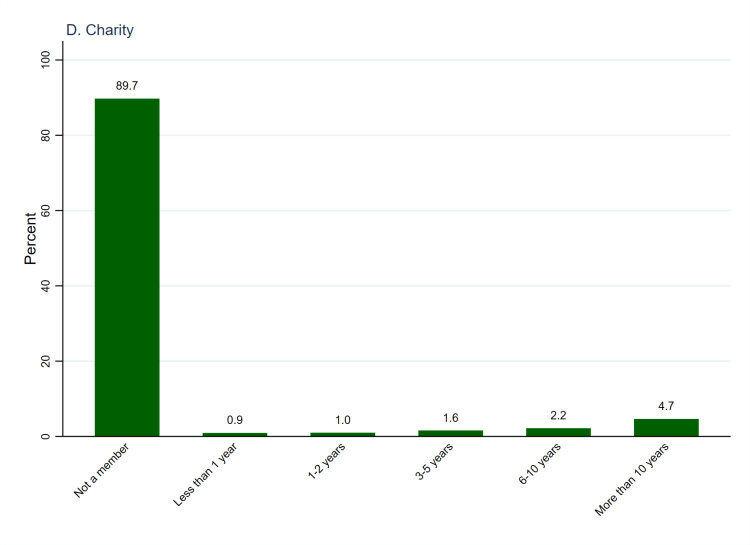
Having asked about involvement with a range of political organisations, the survey asked people who were members of an organisation how long they had held that status. As Figure 1 (above, using weighted data) shows, the vast majority of respondents indicated that they were not members of an organisation and were thus not asked about how long they had held membership.[1] One sixth (16.4%, panel B) of respondents have been members of a trade union or professional association, which are the types of organisation with the highest proportion of people who are members. They are followed by charities (10.3%, panel D), political parties (5.9%, panel A), and campaign organisations (5.4%, panel C). In all cases, the largest category of members is those who have held membership for more than 10 years, though the distribution is flatter for political parties and campaign organisations than for charities and trade unions and professional associations.
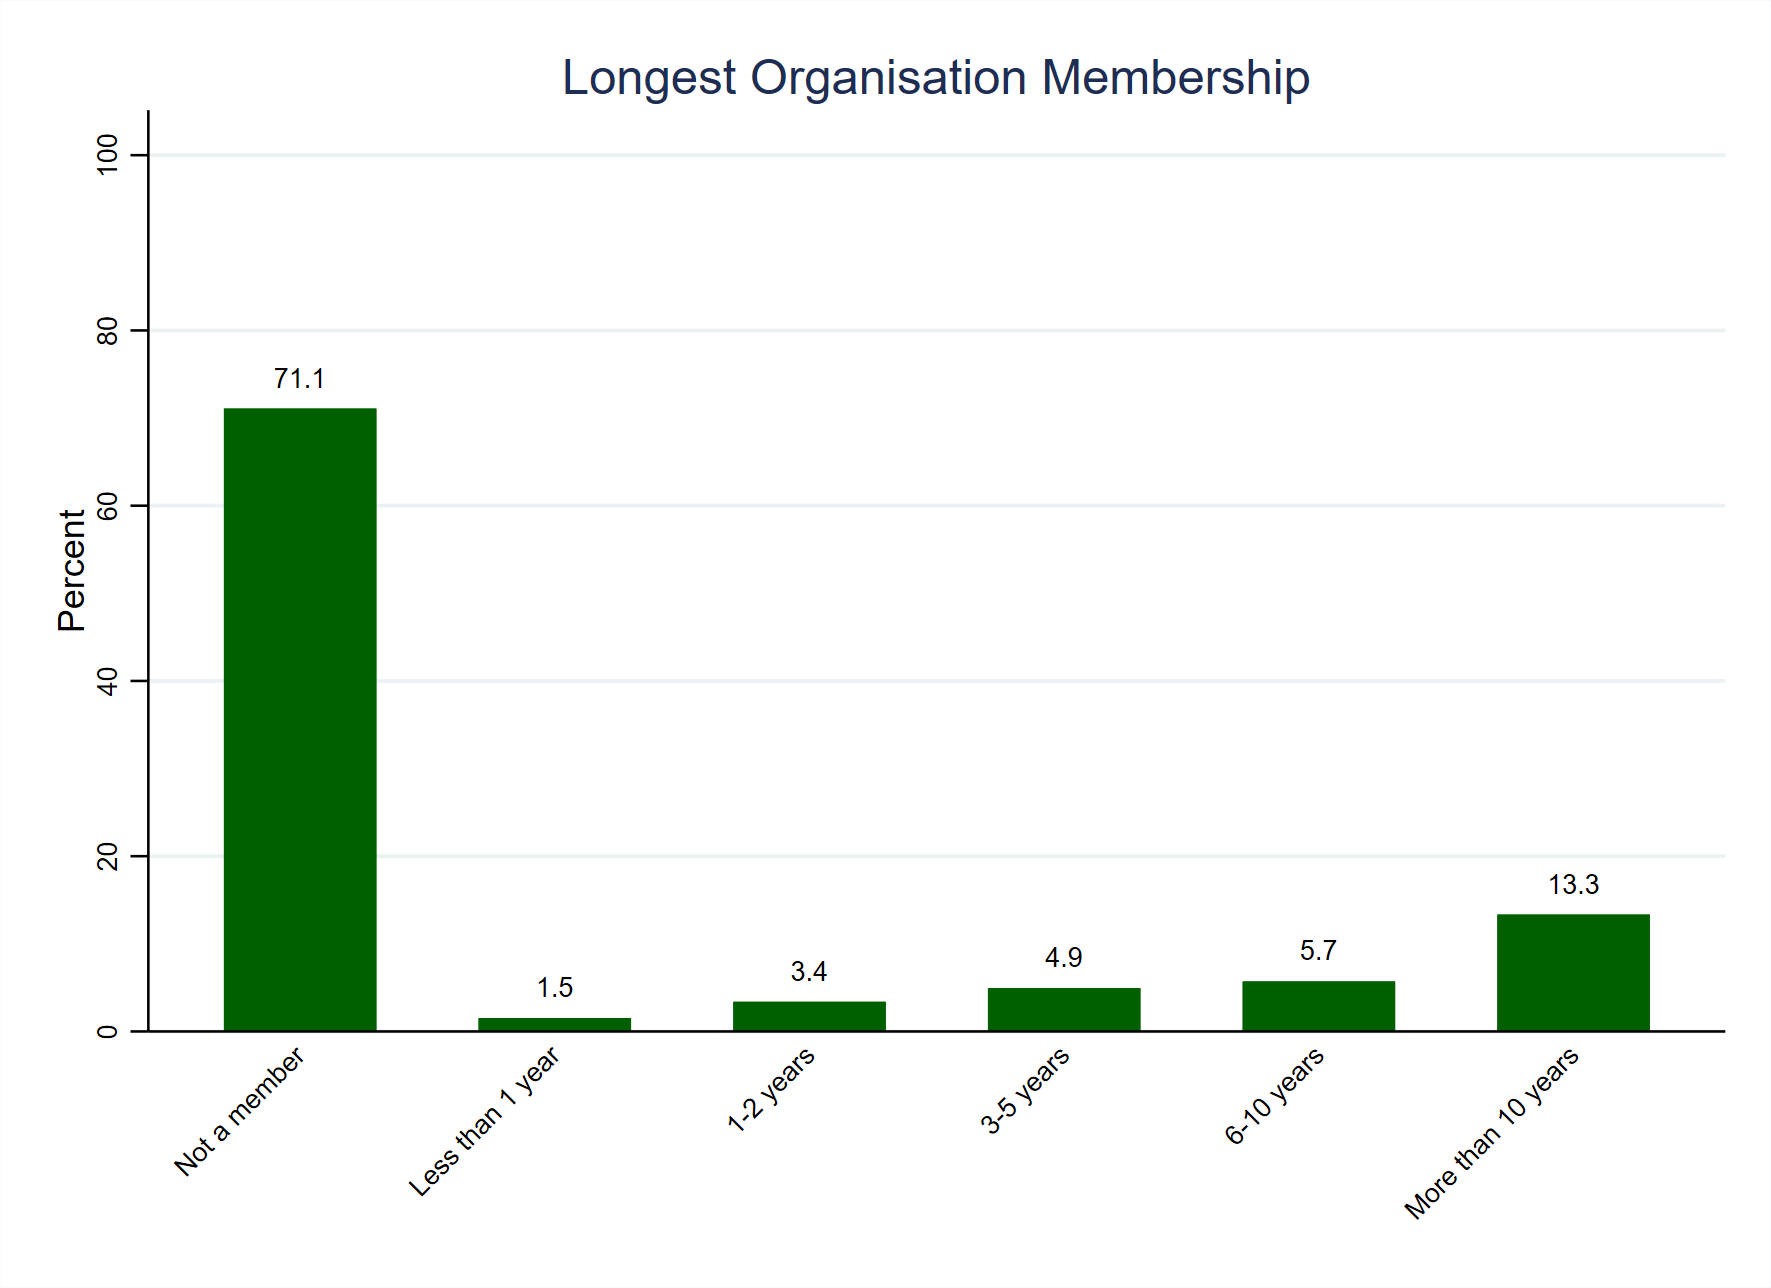
We can also combine the above variables to show the longest amount of time that people have been a member of at least one type of organisation. The results of doing so are graphed in Figure 2 (below, also using weighted data), and show that less than a third of people (28.9%) have been a member of at least one type of organisation for at least some time. Amongst those who are members, there is a clear pattern in which the percentage of people who are members increases with the length of membership. Approaching half of the people who are members (46.0%, or 13.3% of all respondents) have been a member of at least one type of organisation for more than 10 years. This may indicate that membership is disproportionately dominated by older, or at least middle aged, people since it is difficult for younger people to have held membership for more than 10 years. It is also worth pointing out, again, that surveys of respondents drawn from online panels of volunteers (using quotas) tend to greatly over-sample politically active people, including people who are members of political organisations. As such, it is unlikely that such a high proportion of the population at large holds membership of these types of organisations, whatever their length of membership.
| Variables names | pp_memberpp_r, pp_membertupa_r, pp_memberco_r, pp_memberchar_r |
| Number of cases | 1,405 |
| Number of categories | 6 |
| Categories to code as missing | None |
| Cases to code as missing | None |
| Recoded variable names | pp_member_longest |
| Number of cases | 1,405 |
| Number of categories | 6 |
| New and old categories | By default, pp_member_longest is coded as 0 (not a member). If a respondent indicated that they have been a member of at least one type of organisation for ‘Less than 1 year’ (category 1) then pp_member_longest was recoded to ‘Less than one year’ (category 1). If a respondent indicated that they have been a member of at least one type of organisation for ‘1-2 years’ (category 2) then pp_member_longest was recoded to ‘1-2 years’ (category 2). This recoding was repeated, sequentially, for each category. Thus, pp_member_longest indicates the longest that each respondent has been a member of any type of organisation. |
[1] The weighted and unweighted numbers behind Figure 1 can be found in Table 1A.

One thought on “Survey Variable: Membership Length”