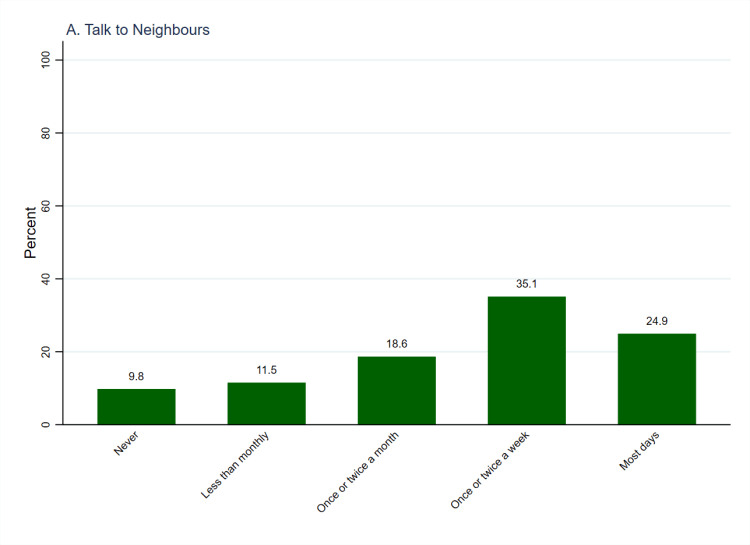
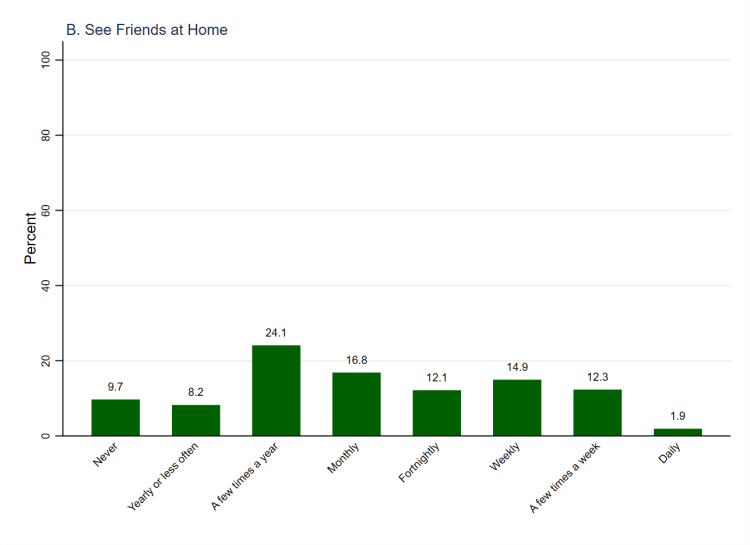
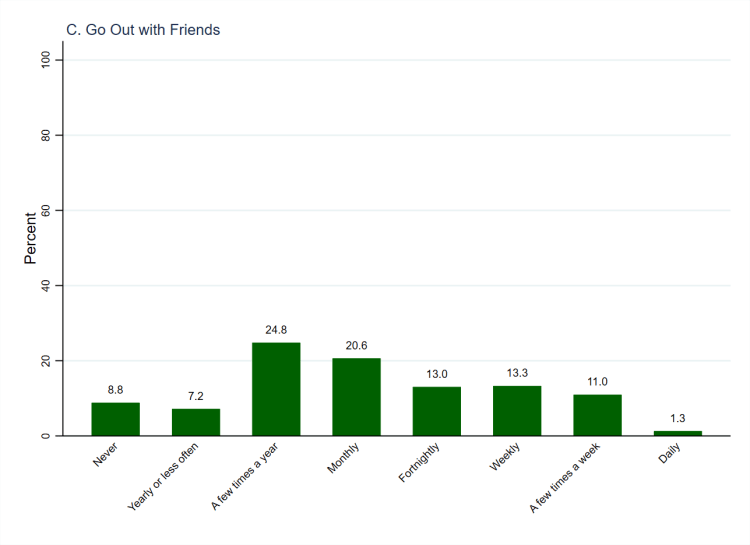
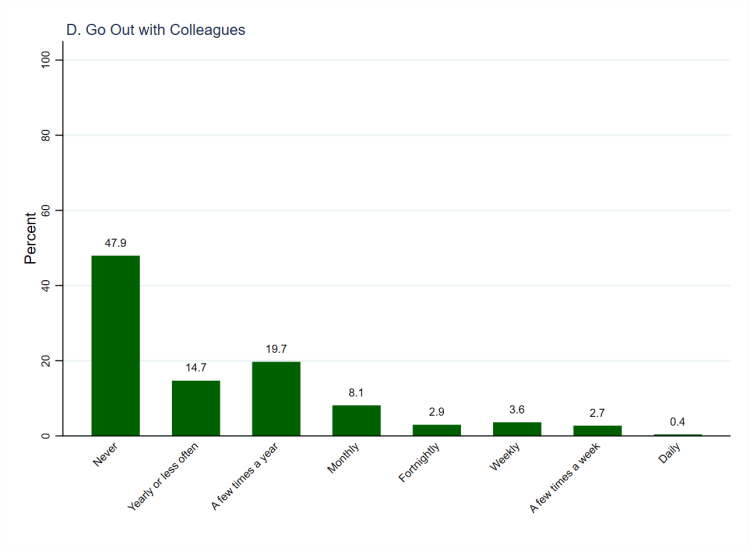
In addition to the statuses of the people who you know, and the number of acquaintances that you have, an important component of social capital is how often you interact with those acquaintances. The survey asked people a series of questions designed to measure social network interaction, focusing on how often people talk to their neighbours, see friends at home, go out with friends, and go out with colleagues. The answers to these questions are shown in Figure 1 (above, using weighted data), which shows that interaction in social networks is moderately frequent.[1] Three in five people (60.0%) talk to their neighbours (panel A) at least once or twice a week, whilst similar proportions (58.0%) see their friends at home (either their own or their friends’, panel B) or go out with their friends (59.2%, panel C) at least once a month. The figure falls to less than a fifth of people (17.7%) when it comes to going out with colleagues at least once a month (panel D). This partly because many people are retired or do not work and were therefore not asked about this form of social interaction (they are included in the 47.9% of people who never go out with colleagues). However, amongst those who are employed, the largest categories indicate that they go out socially with their colleagues a few times a year or less often. Unsurprisingly, then, people socialise (outside work) with their colleagues less frequently than with their friends.
Perhaps more surprisingly, people most frequently socialise with their neighbours. However, the questions do not indicate the intensity of the interactions and can safely assume that interactions with neighbours is less intimate than are interactions with friends. In other words, people probably say a passing ‘hello’ to a neighbour on most days, which may account for the high frequency of interaction (though they may also have more extended conversations too). Beyond this lack of clarity regarding the quality of interactions, the questions also impose boundaries between neighbours, friends, and colleagues that may be blurred. It is possible that neighbours and colleagues become friends, and we do not know how much the groups overlap. This is most important in relation to the assumption that people who do not work also no longer see their colleagues (hence not being asked about the frequency of such interactions). We might assume that people who still see colleagues after ceasing to work with them must consider them to be friends, but perhaps this is not the case.
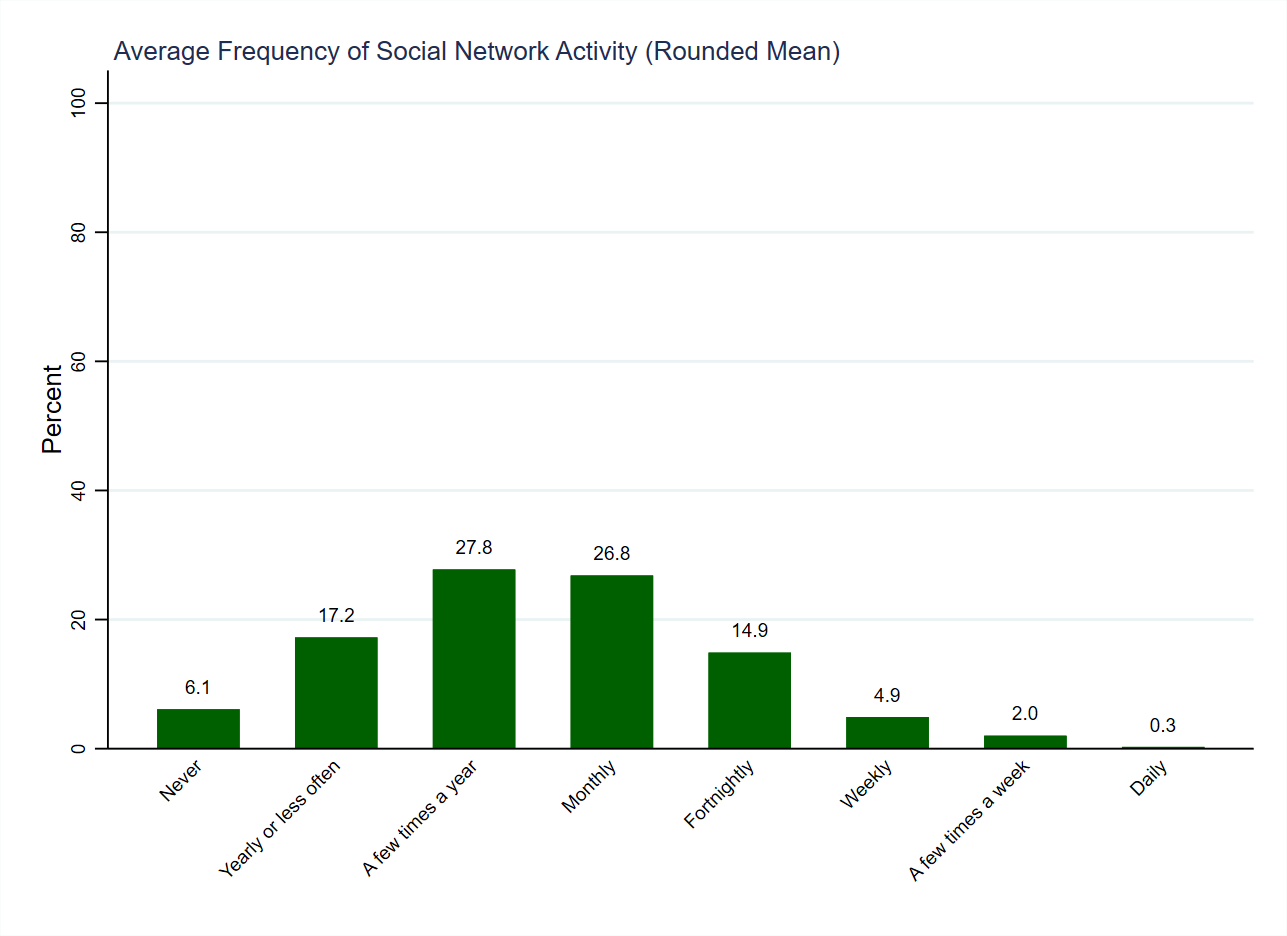
It remains to be seen whether frequency of interaction with different groups is related such that people who interact with their friends with high frequency are also more likely to interact often with their neighbours and colleagues. However, we can observe the average frequency of interaction with friends, at home and when going out, and colleagues (talking to neighbours is excluded because it has different answer categories). This is displayed in Figure 2 (below, also using weighted data), which shows that more than half of respondents (54.6%) interact with their friends and colleagues, on average, a few times a year or monthly. It is also the case that around half of people (48.9%) interact with their friends and colleagues at least monthly, on average, whilst the other half (51.1%) do so less often. Thus, on average, people have moderately frequent interaction with their acquaintances, rather than very frequent or infrequent interaction.
| Variable names | sc_neighbour_talk, sc_friends_home, sc_friends_out, sc_colleagues_out |
| Number of cases | 1,405 |
| Number of categories | 6 (sc_neighbour_talk) or 9 (sc_friends_home, sc_friends_out and sc_colleagues_out) |
| Categories to code as missing | None |
| Cases to code as missing | None |
| Recoded variable names | sc_neightalk_irmv, sc_friendhome_irmv, sc_friendout_irmv, sc_collout_irmv, sc_activ_ave |
| Number of cases | 1,405 |
| Number of categories | 5 (sc_neightalk_irmv) or 8 (sc_friendhome_irmv, sc_friendout_irmv, sc_collout_irmv and sc_activ_ave) |
| New and old categories | The ‘Not Asked’ (9 for sc_neighbour_talk, 99 for sc_friends_home, sc_friends_out and sc_colleagues_out) category applied to respondents who had previously indicated that they do not know any of their neighbours, do not have any friends, or do not work. As such, they were recoded into the category indicating that they ‘Never’ interact with the groups in question. The new variables are all coded such that 0 indicates ‘Never’ interacting with the group. In the case of sc_neightalk_irmv, the highest numerical category, 5, indicates interacting with neighbours ‘On most days’. For the other variables, the highest category, 8, indicates interacting with the group daily. Finally, the average variable (sc_activ_ave) was calculated by taking the mean of the variables relating to friends and colleagues (which share the same answer categories) and then rounding it to the nearest whole number, resulting in the same answer categories as the variables upon which it is based. |

3 thoughts on “Survey Variable: Social Network Interaction”