There are numerous ways to ask about people’s political engagement and how they think politics relates to them. Two of the most straightforward questions in this area ask about whether people think of themselves as political, and whether they think politics is for people like them. The survey asked both of these questions and randomise the order in which people saw them. This opens up the possibility of observing whether people answer the questions differently depending on whether they first think about themselves (whether a ‘political person’ or not) or the political system (for ‘people like you’ or not), and this will be investigated subsequently.
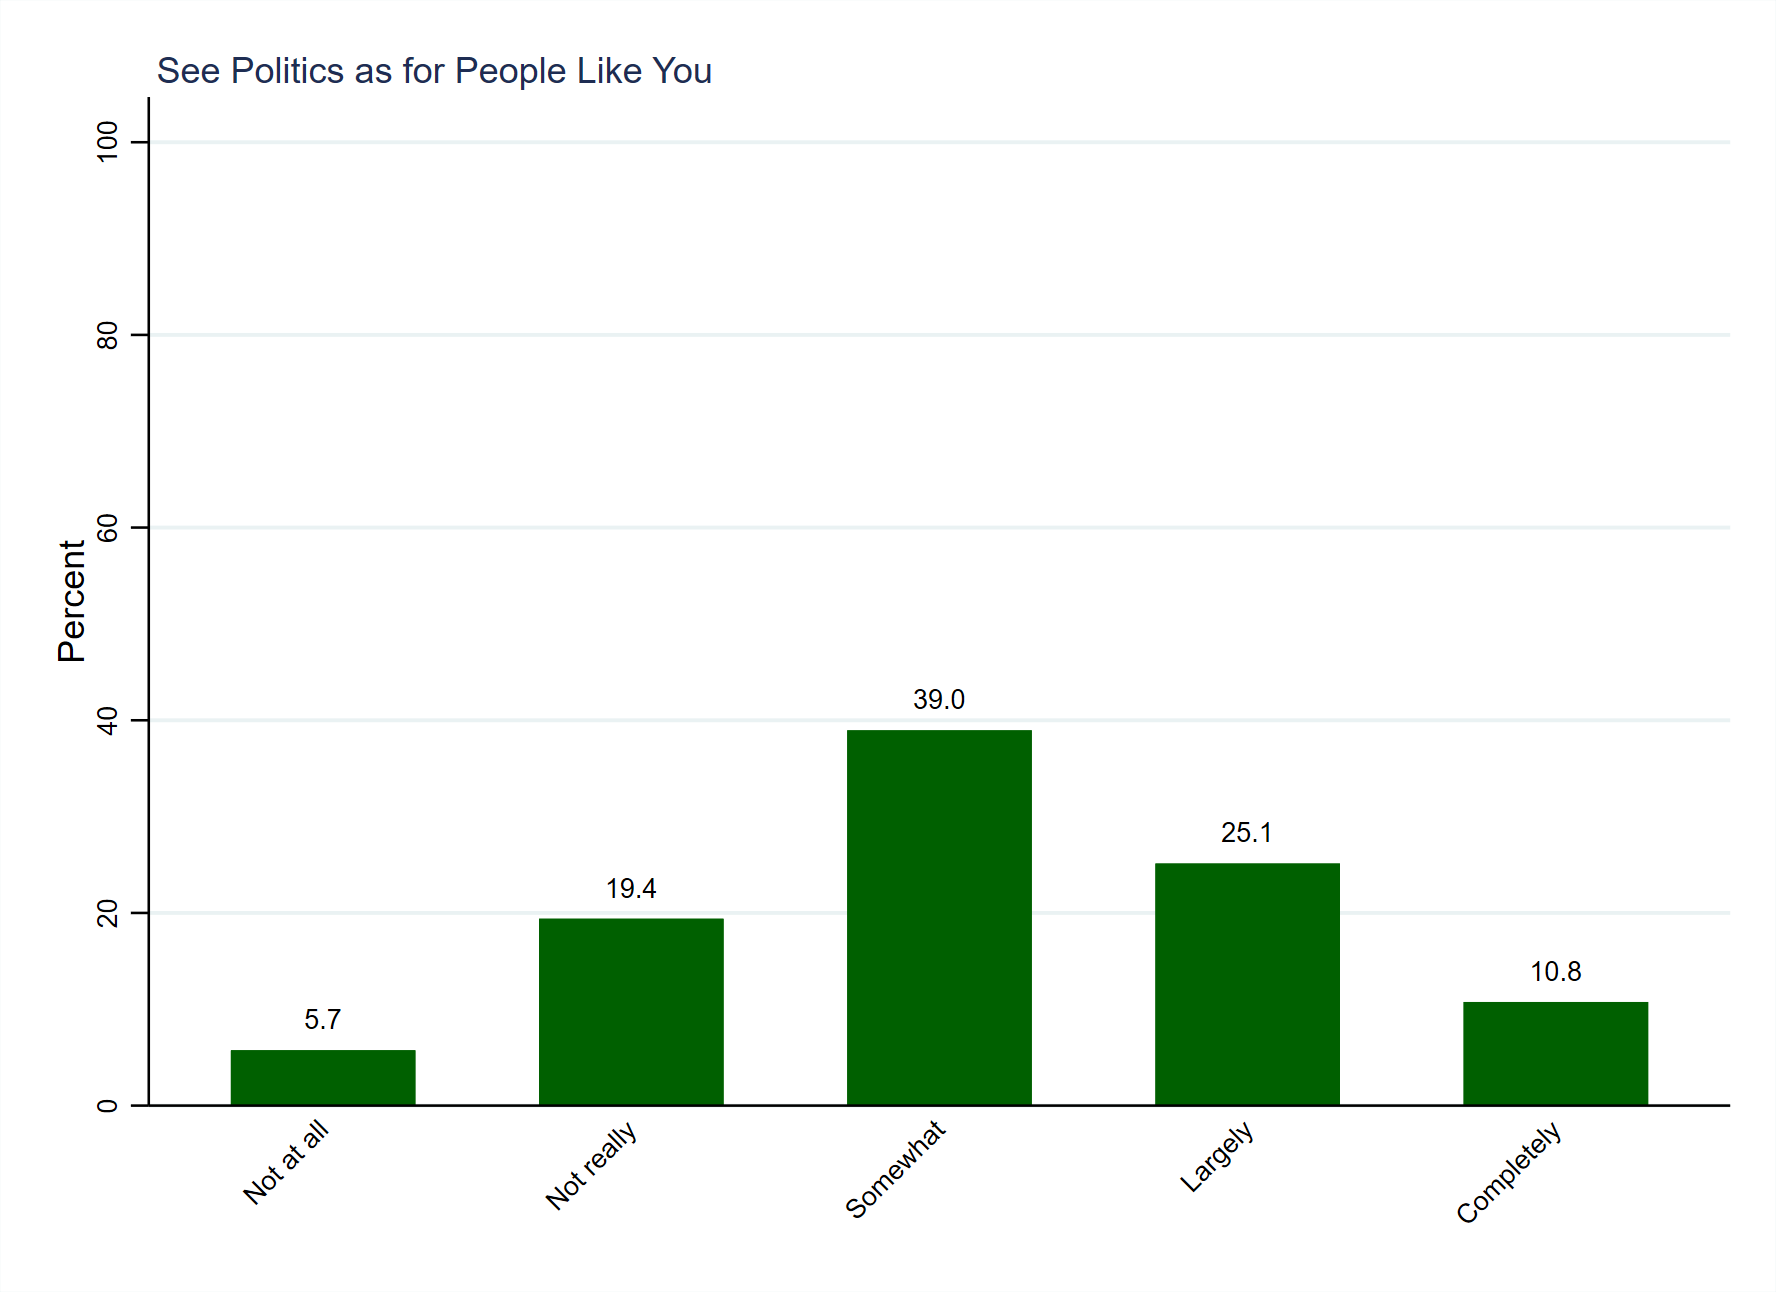
For now, we can observe the answers to the question of whether politics is for ‘people like you.’ Figure 1 (above, using weighted data) shows that almost two fifths (39.0%, a plurality) opt for the middle answer of ‘Somewhat’ when this question is posed. The distribution is then approximately normally distributed around that option, though a more than a third of people (35.9%) indicate that politics is for people like them whilst a quarter (25.1%) indicate that it is not. Thus, people tend to have a middling assessment of whether politics is for people like them but err on the positive side when departing from the middle option.
The slightly positive appraisal of the accessibility of politics may reflect the higher levels of political engagement that are observed amongst voluntary online survey samples, and the general population (and close-to-probability samples drawn from it) may be less positive. Further, whilst some respondents’ answers might indicate whether politics as currently practiced is for the population, other respondents’ answers may indicate an assertion of the principle that politics should be for people like them, and we cannot know the thought processes of respondents as they answered the question. We can, however, observe whether people’s answers to this question relate to whether they think of themselves as a political person, as well as to other measures of political engagement, and this will be investigated subsequently.
| Variable names | poli_polforyou1, poli_polforyou2 |
| Number of cases | 1,405 |
| Number of categories | 6 |
| Categories to code as missing | 9 (‘Not asked’) |
| Cases to code as missing | 701-704 |
| Recoded variable name | pe_pfy_cir |
| Number of cases | 1,405 |
| Number of categories | 5 |
| New and old categories | The two original questions have identical wordings and answer options, and were asked separately as part of a question order experiment. As such, they needed to be combined into a single variable containing all respondents’ answers. At the same time, the numerical values of the answers were inverted (by deducting the original answers values from 5) so that higher values equate to a greater sense that ‘politics is for people like you.’ In light the above, the scale of the new variable runs from 0 (‘Not at all’) to 4 (‘Completely’). This is in contrast to the original two variables, which ran from 1 (‘Completely’) to 5 (‘Not at all’). The respondents with missing values on the first of the two original questions gave substantive answers on the second, and vice versa. Thus, the combination of the two variables into the new variable eliminates the ‘Not asked’ (9) category, and there are no missing values. |

2 thoughts on “Survey Variable: Politics for You”