
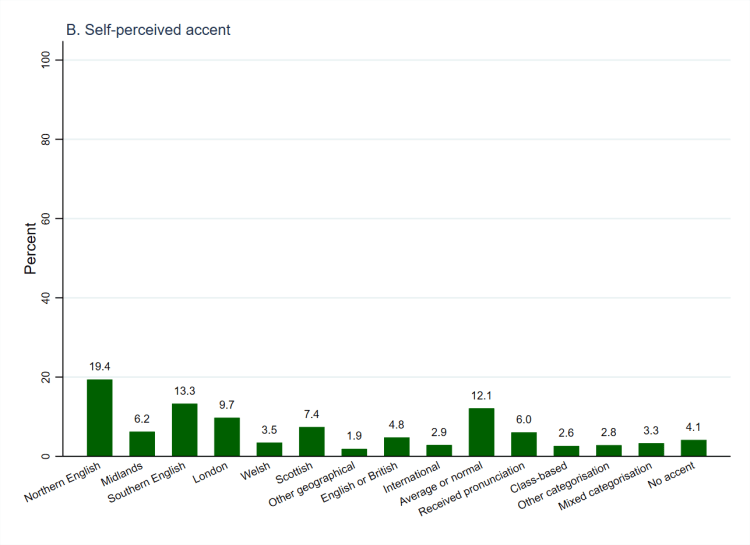
Given that it can be a prominent indicator of one’s background, the Privilege and Participation survey asked people about their accents. Specifically, it asked them whether they think that they have a regional accent and then, whether they answered yes or no, to write in how they would describe their accent. The written answers were manually coded, and the results can be seen in Figure 1 (above, using weighted data).[1] More than half of people (56.5%) think of themselves as having a regional accent (panel A), leaving more than two fifths (43.5%) who think that they do not. When asked what their accent is (panel B), one fifth (19.4%, a plurality) give answers relating to Northern England and a further one in eight (13.3%) give answers relating to Southern England. A similar (one in eight, 12.1%) say that they have an average or normal accent, whilst one in ten (9.7%) give answers relating to London. None of the other categories includes more than one in thirteen people but, collectively, more than six in ten people (62.4%) give an answer that relates to a region or other geographical location within the United Kingdom.
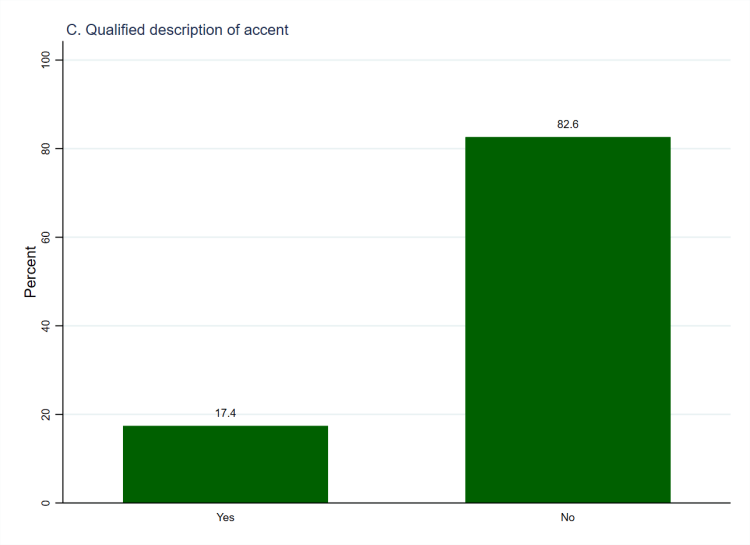
One in seventeen people (6.0%) indicate that they speak with received pronunciation or something similar and, relatedly, slightly more than one in forty people (2.6%) describe their accent in terms of class. We can also assume that the people who describe themselves as having an average or normal accent, or generic English or British (4.8%) ones, do not think of themselves as having a strong regional accent. Nevertheless, there are both geography-based and class-based implications of such accents that people may pick up on when they hear them. The accents that people have are, however, not always simple and they may reflect multiple influences in their lives. Indeed, one in six people (17.4%) qualify the accent that they say they have (panel C) for instance by saying that their accent is ‘soft’ or that their accent reflects growing up in one place and living in another. Nevertheless, this leaves more than four fifths (82.6%) who give a simple or clear-cut answer about their accent and we can suppose that their accents would be relatively easy for others to discern.
| Category | Example Answers |
| Norther English | Manchester, Mancunian, Liverpool, Scouse, Newcastle, Geordie, Northern |
| Midlands | Birmingham, Brummie, Black Country, Derby, Leicester, West or East Midlands |
| Southern English | Essex, Kent, Hampshire, Norfolk, Bristol, Somerset, Home Counties, Southern |
| London | London (including North and South), East End, Cockney |
| Welsh | Welsh (including North and South) |
| Scottish | Glasgow, Edinburgh, Lowland, Highland, Scottish |
| Other geographical | Fenland, Rural, Northern Irish |
| English or British | English, British |
| International | African, American, Asian, Canadian, European, French, Indian, Italian, Latin, Foreign, International |
| Average or normal | Average, normal, neutral, middle of the road, no category, not pronounced, standard, down to earth, inconspicuous |
| Received pronunciation | Received pronunciation, RP, Queen’s English, BBC |
| Class-based | Common, Middle Class, Working Class |
| Other categorisation | Badly spoken, mild, distinct, awful, strong, understandable |
| Mixed categorisaton | Mixed up, mixture, hybrid, combination |
| No accent | None, no accent, non-specific, nothing in particular, don’t really have one |
