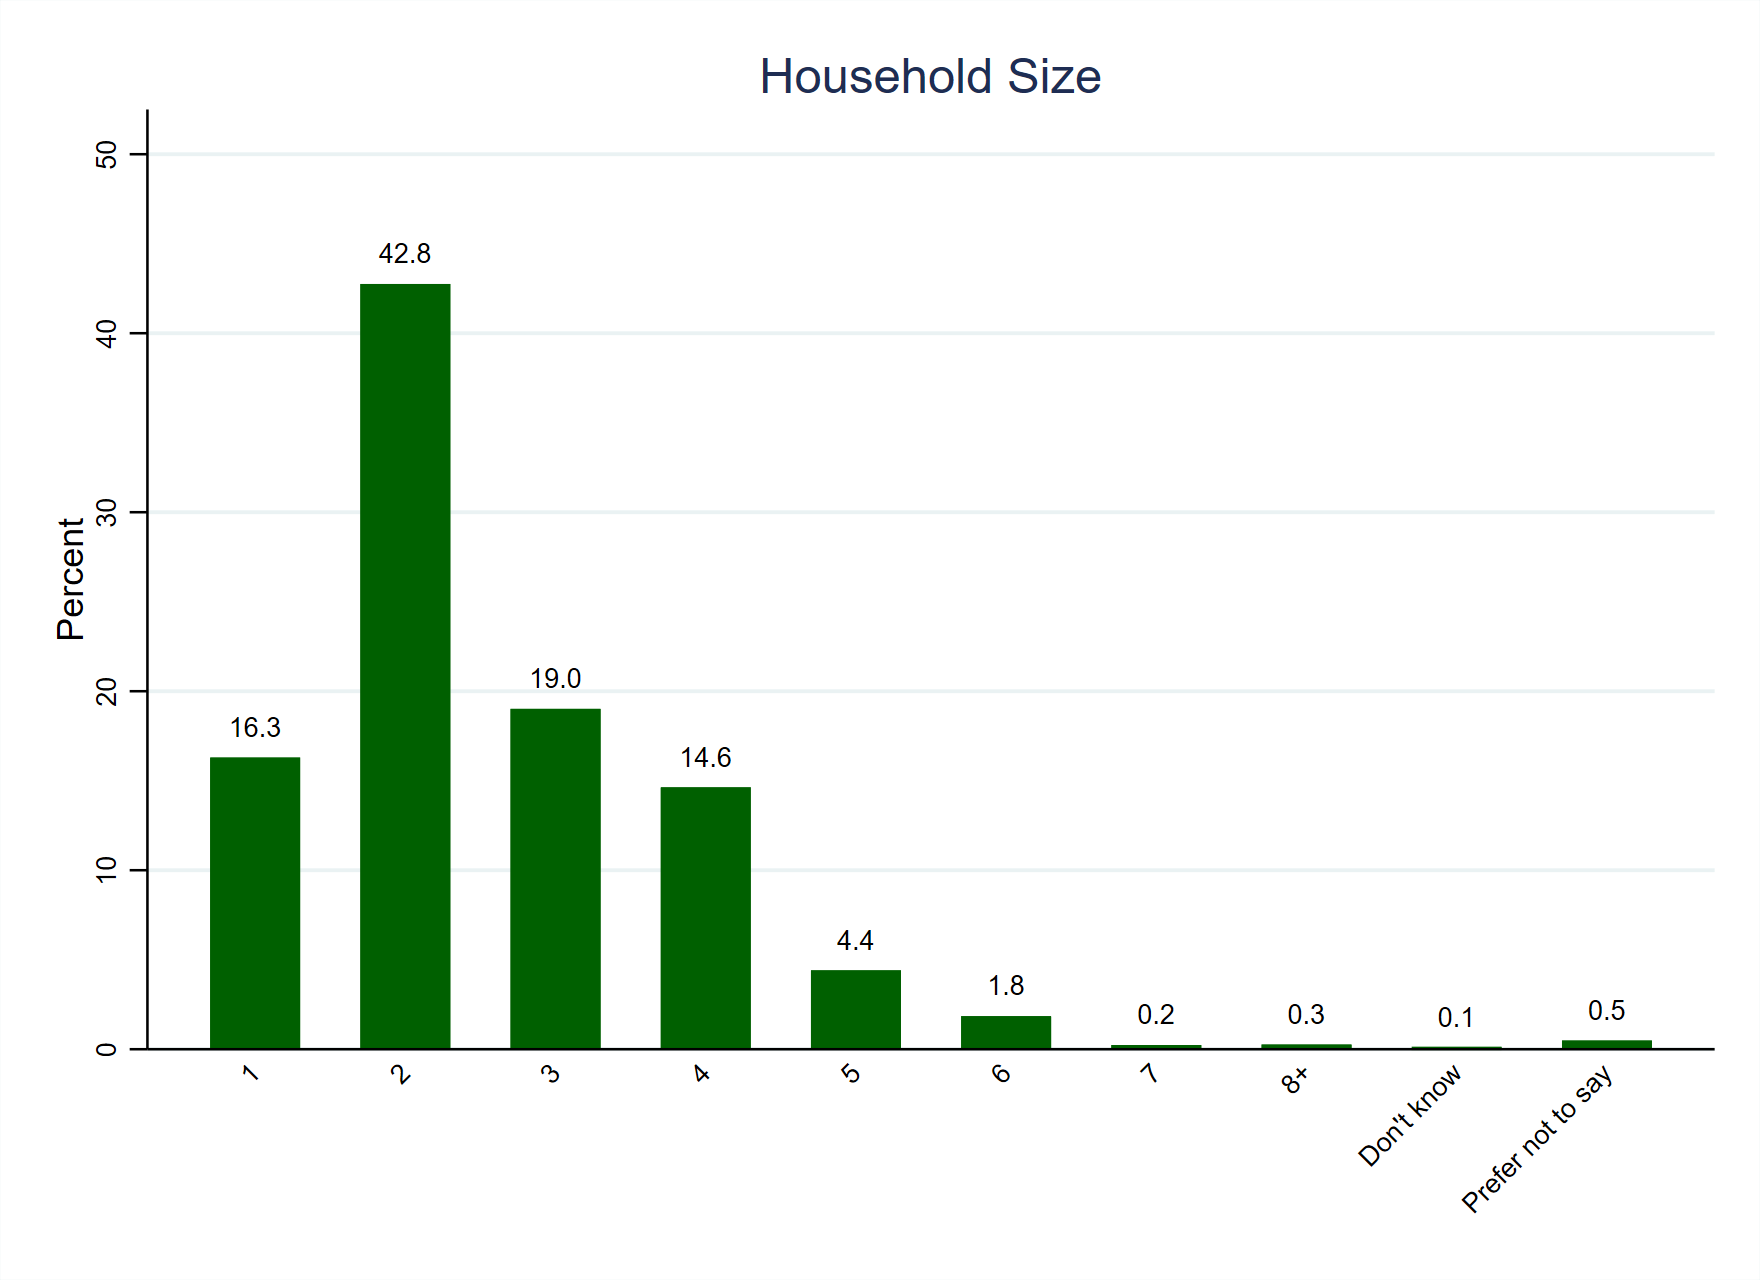
The household size variable indicates how many people live in respondents’ households and Figure 1 shows that slightly more than two fifths (42.8%) of the weighted sample live in two-person households. Further, slightly below one fifth (19.0%) live in three-person households, whilst approaching one third reside in either one-person (16.3%) or four-person (14.6%) households. Together, then, more than nine in ten (92.7%) respondents live in household of between one and four people. There is a very small group (0.6%, n = 9) who answered ‘Don’t know’ or ‘Prefer not to say’ to the question and are set as missing values in the recoded variable, which is graphed in Figure 2. The variable otherwise remains the same as the original and details of both are presented below Figure 2.

| Variable name | back_houssize |
| Number of cases | 1,405 |
| Number of categories | 10 |
| Categories to code as missing | ‘Don’t know’ and ‘Prefer not to say’ |
| Cases to code as missing | 9 |
| Recoded variable name | back_houssize_mv |
| Number of cases | 1,396 |
| Number of categories | 8 |
| New and old categories | ‘1’ to ‘8’ = ‘1’ to ‘8’ Missing = ‘Don’t know’ + ‘Prefer not to say’ |

One thought on “Survey Variable: Household Size”