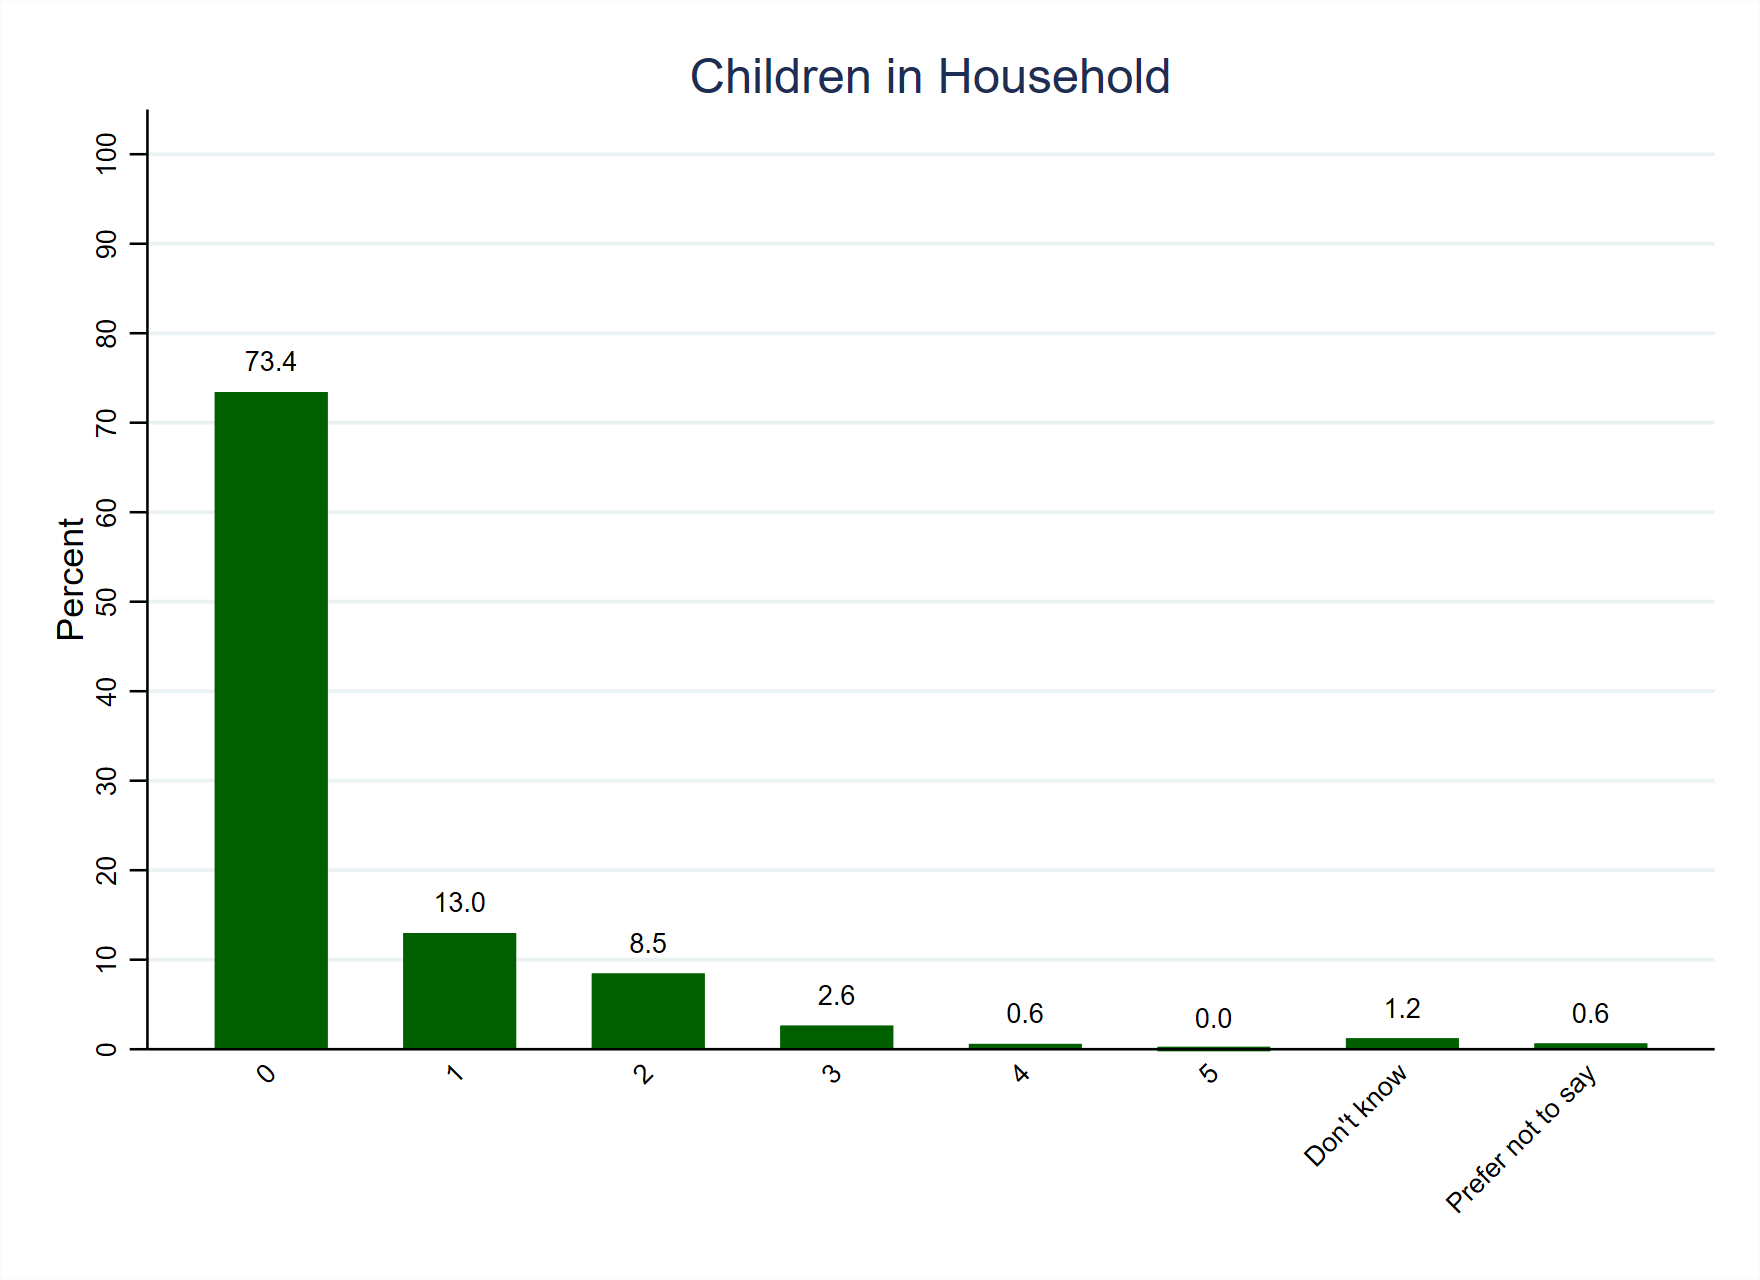
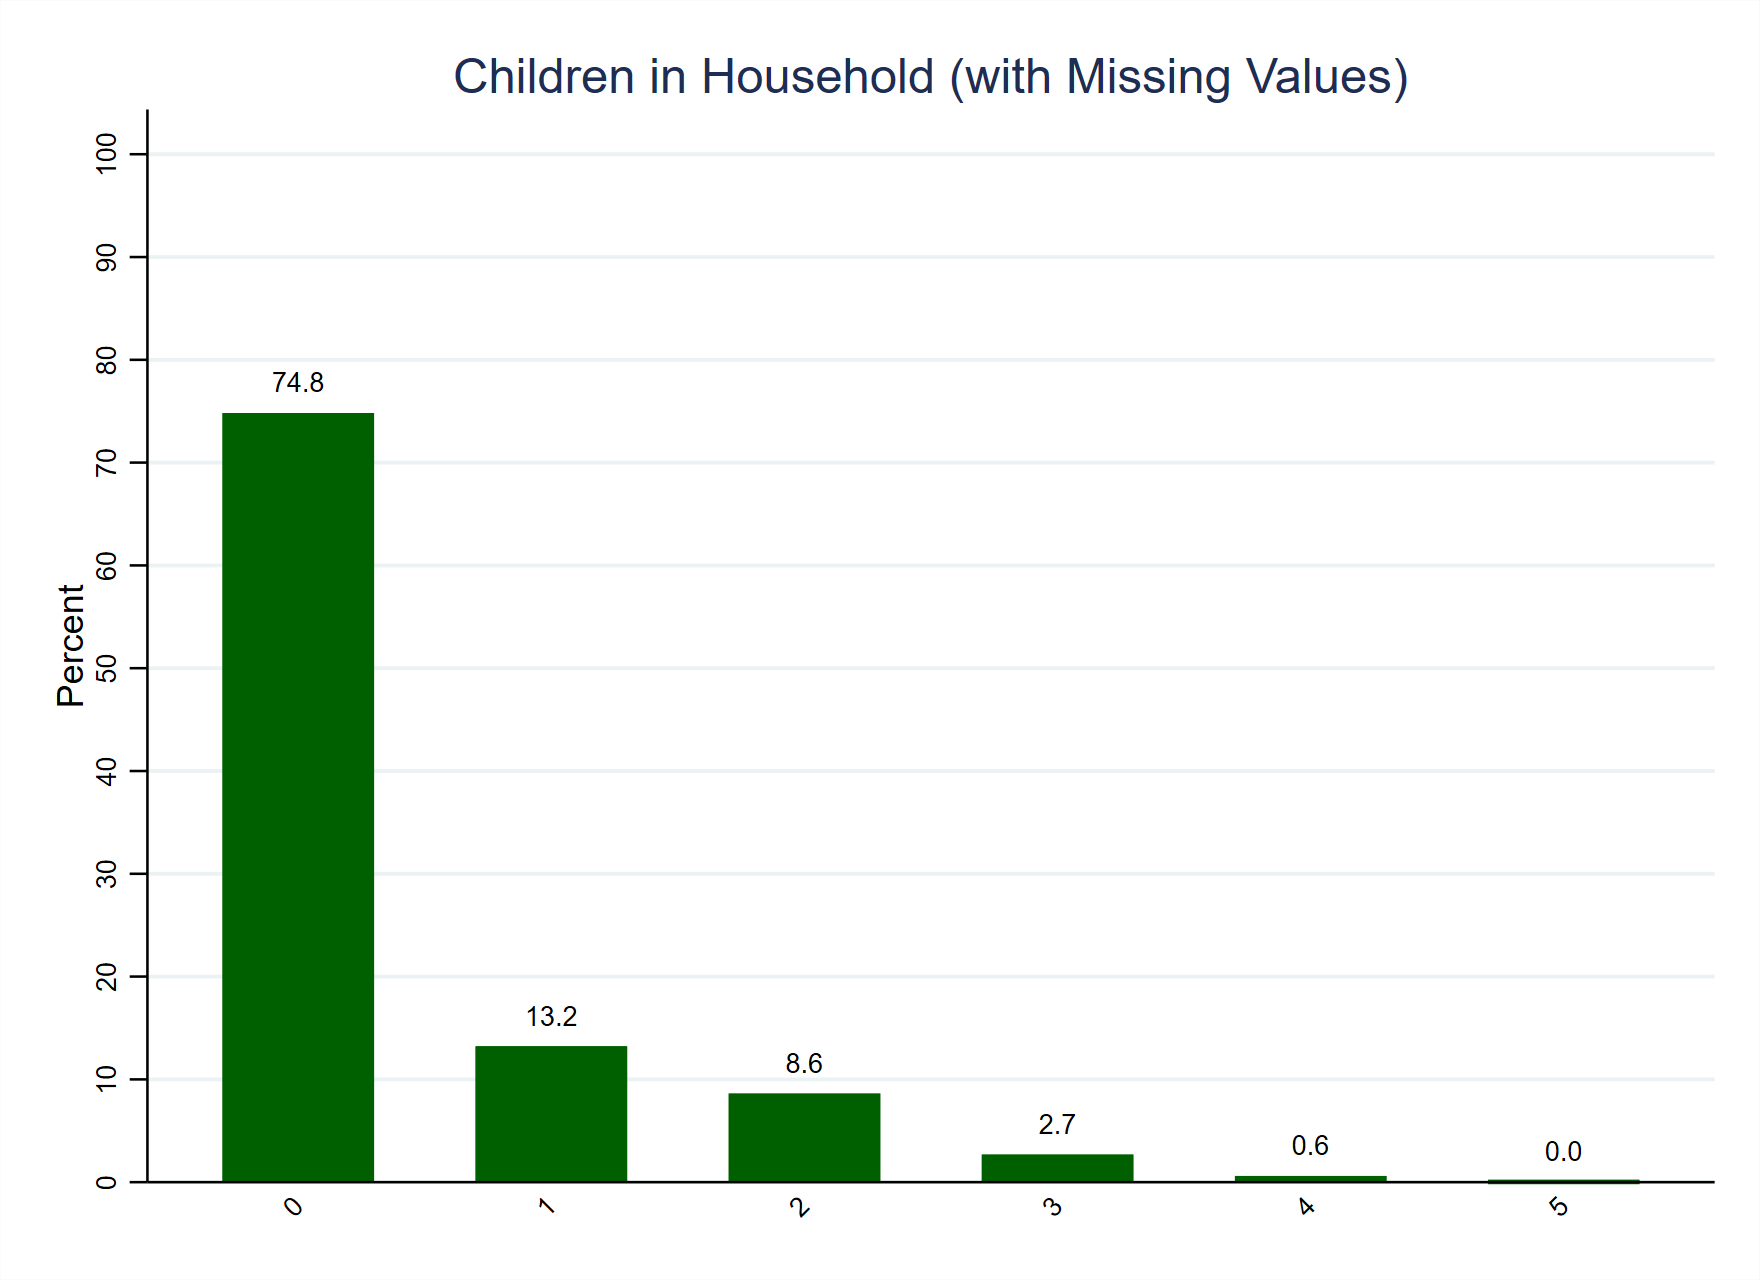
The child status variable indicates how many children live in respondents’ households, and Figure 1 shows that almost three quarters (73.4%) of the weighted sample live in households with no children. This group includes both young people who may not have had children and old people who may have children who have left home (the youngest person in the group is 19, whilst the oldest is 87, and the weighted mean age is 51). The only recoding of the variable that is required is to code the small percentages of ‘Don’t know’ (1.2%) and ‘Prefer not to say’ (0.6%) answers as missing values. This removes 22 cases from the variable, which is graphed in its new form in Figure 2. Details of the original and recoded variables are provided at the bottom of the post.
This variable also gives us an opportunity to check the consistency of respondents’ answers by cross-referencing it with the household size variable. It is not possible to live in a household with more children than people overall (or, indeed, the same number of children as people overall), so when we draw a table of household size by children in household we should not observe any such cases. As can be seen in Table 1, there are five cases that do not conform to this logic: one respondent who lives in a one-person household with two children; three respondents who live in a two-person household with two children; and one respondent who lives in a four-person household with 4 children. Both of the variables draw on data that was already held by YouGov (which is periodically updated) and were only updated in the survey if respondents had not answered them previously. As such, it is possible that the two questions were previously asked to respondents at different times, with circumstances changing in between them, or that respondents simply answered one (or both) of the questions incorrectly. Given the small number of cases, and the uncertainty about the cause of the mismatch, they are not be coded as missing.

| Variable name | back_chilstat |
| Number of cases | 1,405 |
| Number of categories | 8 |
| Categories to code as missing | ‘Don’t know’ and ‘Prefer not to say’ |
| Cases to code as missing | 22 |
| Recoded variable name | back_chilstat_mv |
| Number of cases | 1,383 |
| Number of categories | 6 |
| New and old categories | ‘0’ to ‘5’ = ‘0’ to ‘5’ Missing = ‘Don’t know’ + ‘Prefer not to say’ |

One thought on “Survey Variable: Children in Household”