
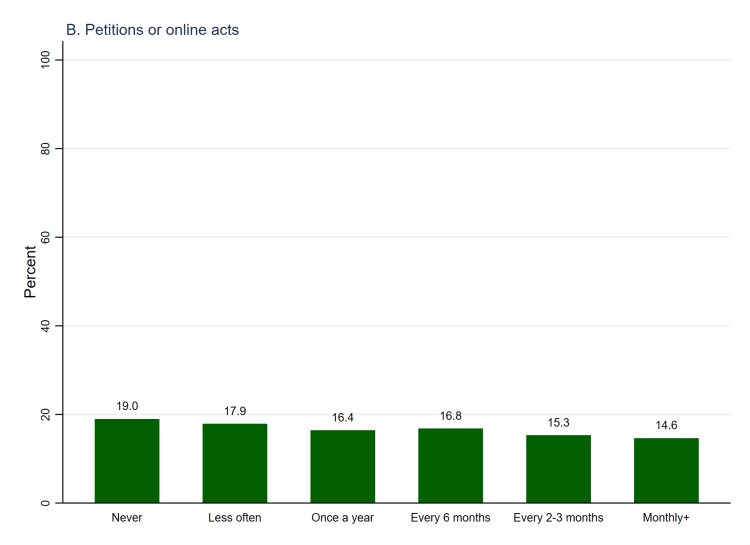
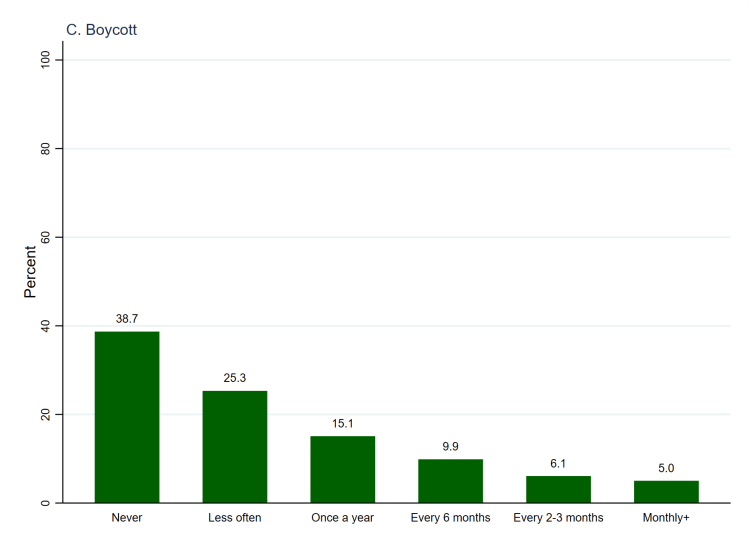
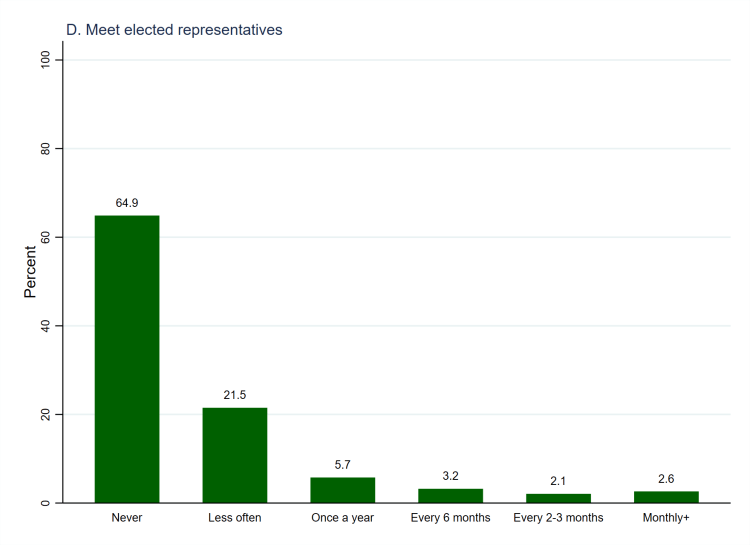
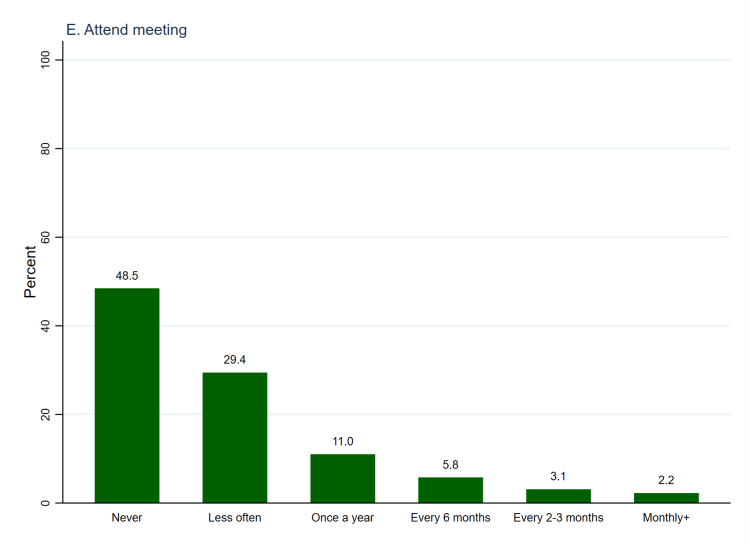


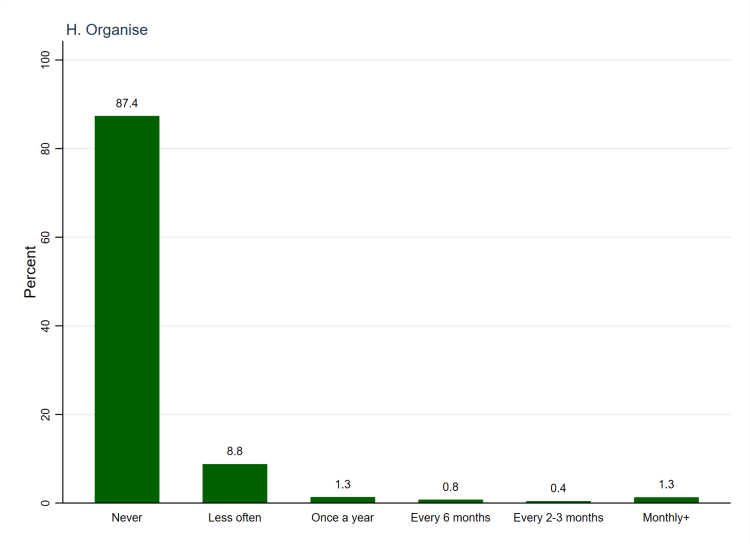
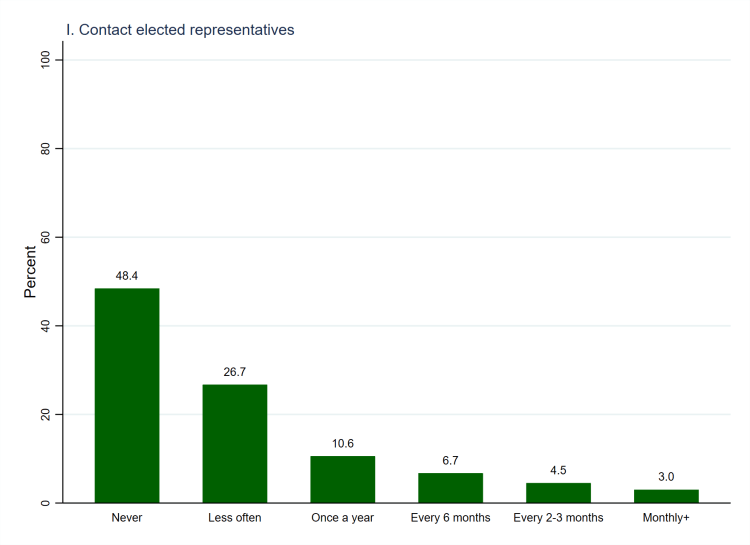
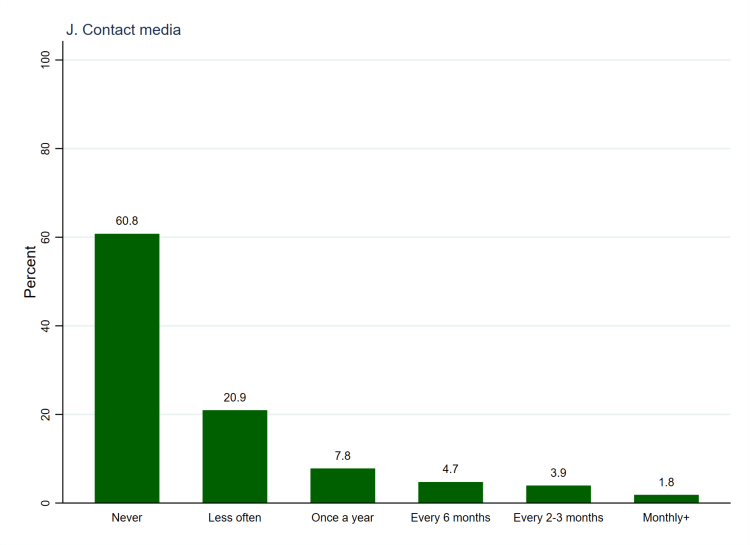
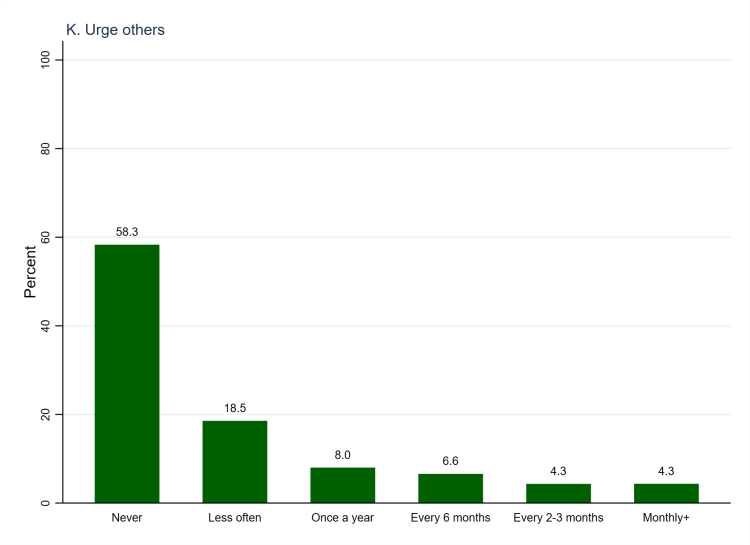
Having considered the voluntary official positions that citizens can hold, we now move onto the specific political (whether explicitly or implicitly so) acts that people can undertake. As shown in Figure 1 (above), which uses weighted data, there is quite some variation in the frequency with which people engage in such acts.[1] At one end of the spectrum we can see the flat distribution relating to signing petitions or taking online actions (Panel B), indicating that between one in five (19.0%) and one in seven (14.6%) of people do those things with each level of frequency (ranging from never to monthly or more often). At the other end of the spectrum is direct action (Panel G), which is only done with any frequency by one in eighteen people (5.7%). There is a general tendency in which the more demanding political acts are done less frequently by a greater proportion of people. Indeed, seven of the eleven acts that the survey asked about are never done by a majority of people.
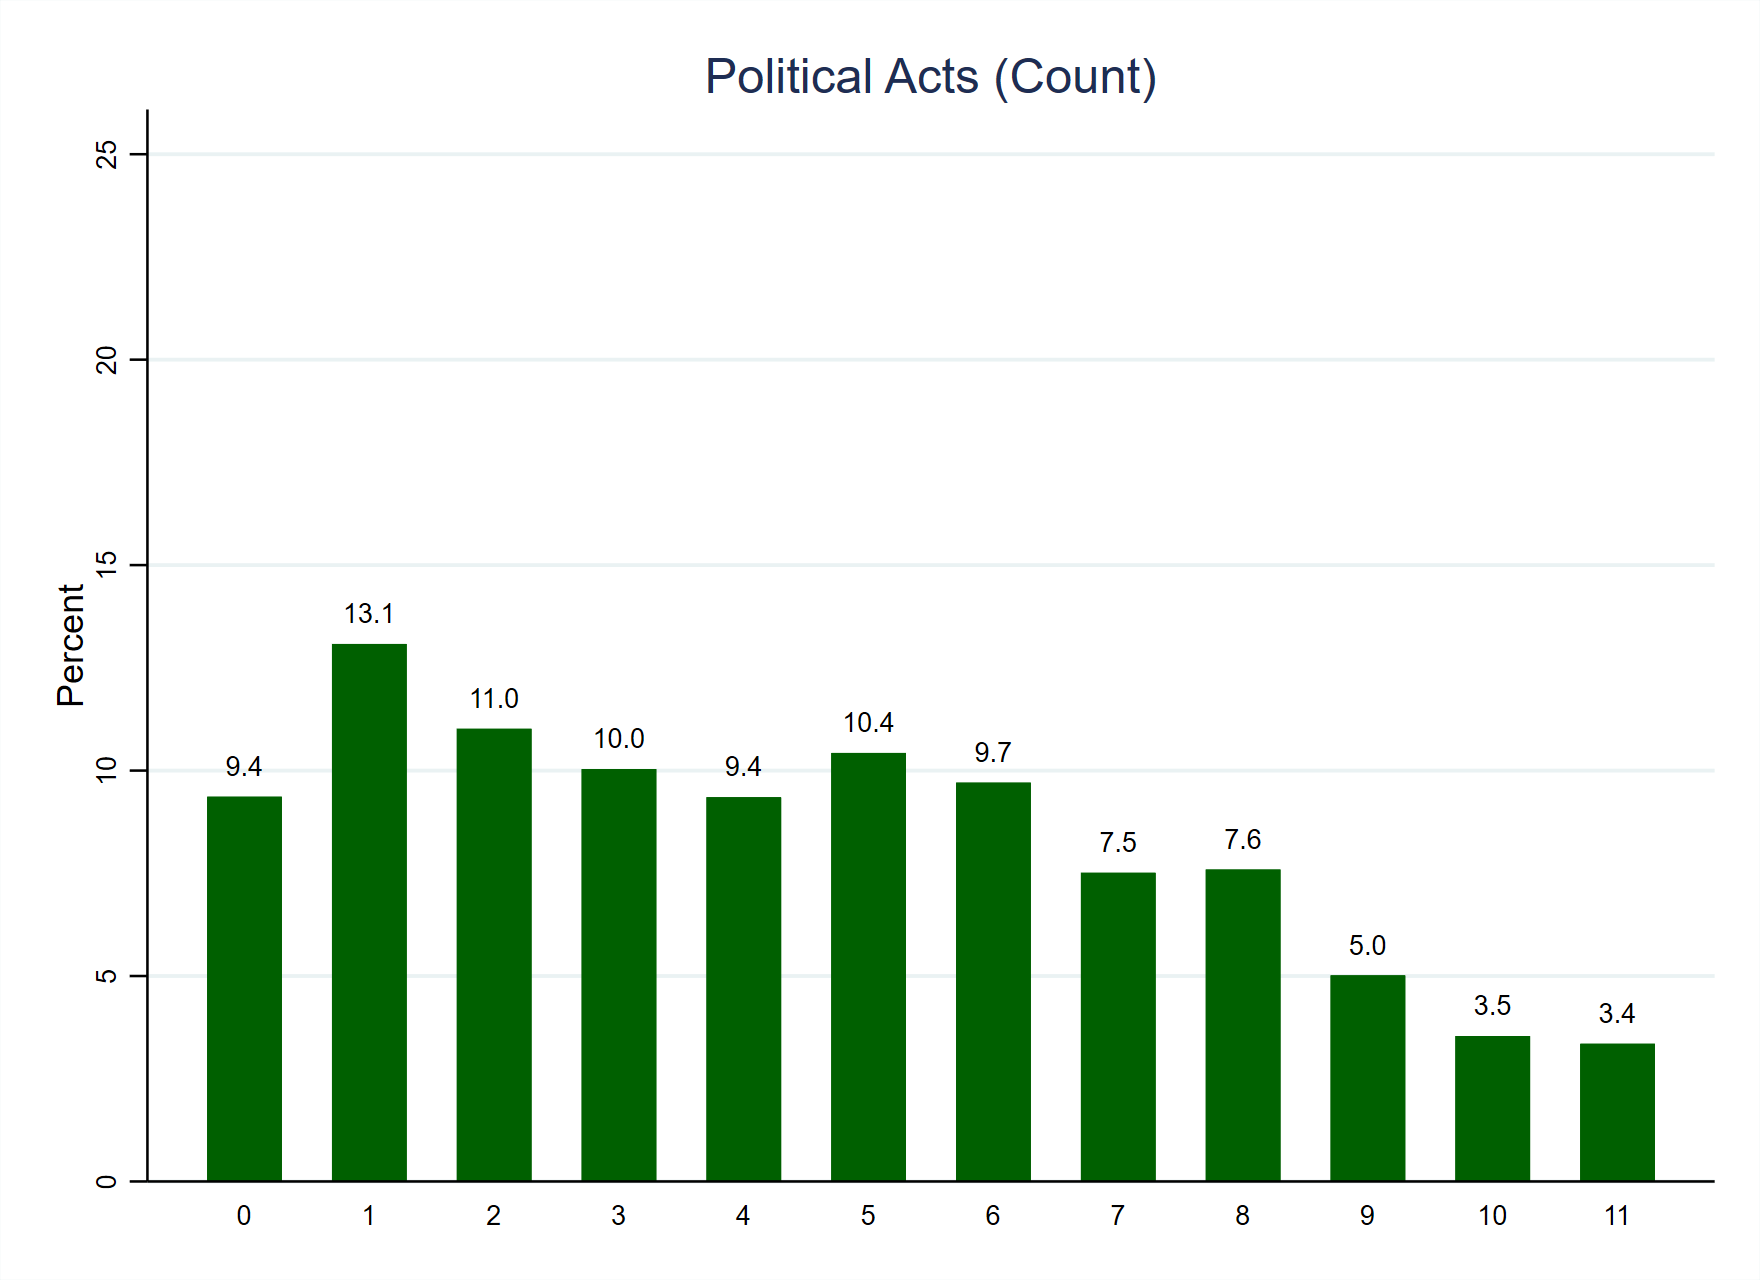
As with official positions, we can summarise these acts by calculating a variable counting the number of acts that each person ever undertakes (there are no missing values to exclude), and this is graphed (using weighted data) in Figure 2. The distribution is less steep than we might expect, and a small plurality (13.1%) only ever do one political act. A majority of people (52.9%) undertake four or fewer acts, but close to half (47.1%) undertake between five and eleven acts. The fact that at least some level of political activity is so widespread may indicate the rude health of democracy in pre-Brexit Britain. However, it also reflects the fact that surveys, and especially surveys of respondents drawn from online panels of volunteers (with quotas to ensure that they are representative of the population in terms of key demographic and political characteristics), tend to greatly over-sample politically active people. This is less problematic when we look at the relationships between variables, but it means that we should read these estimates (weighted or otherwise) of how much political activity was occurring in pre-Brexit Britain with caution.
| Variable names | pp_paf_materials_ir, pp_paf_petitonlin_ir, pp_paf_boycott_ir, pp_paf_meetelecrep_ir, pp_paf_attmeet_ir, pp_paf_protest_ir, pp_paf_directact_ir, pp_paf_orgmeegro_ir, pp_paf_contpol_ir, pp_paf_contmed_ir, pp_paf_urge_ir |
| Number of cases | 1,405 |
| Numer of categories | 6 |
| Categories to code as missing | None |
| Cases to code as missing | None |
| Recoded variable name | pp_paf_count |
| Number of cases | 1,405 |
| Number of categories | 12 |
| New and old categories | Categories 1 (‘Less often’), 2 (‘Once a year’), 3 (‘Every 6 months’), 4 (‘Every 2-3 months’), and 5 (‘Monthly+’) on each of the original variables were counted as 1 (i.e. indicating that the act has been done at some point), with category 0 (‘Never’) counted as zero. As such, 0 on the new variable indicates that no acts have ever been done whilst 11 indicates that all 11 acts have been done with some frequency. |
[1] The weighted and unweighted numbers behind Figure 1 can be found in Table 1A.

8 thoughts on “Survey Variable: Political Acts”