
Respondents who indicated that they didn’t do any political acts or get involved in any organisations (n = 505) were asked to indicate the reasons for their lack of involvement. As Figure 1 (using weighted data) shows, the two most common answers are lack of money and lack of time, which were each selected by more than a third of respondents (36.7% and 35.6% respectively). There is a notable gap between those reasons and the next most popular, lack of confidence, which was selected by just over a fifth of respondents (22.5%). That is closely followed by such activities not being seen as ‘for people like me,’ which was selected by almost a fifth of respondents (19.8%). Not being asked, lacking skills, lacking knowledge, or thinking that such activities make no difference were all selected by between one in six and one in seven respondents (ranging from 16.6% to 14.4%), whilst other reasons (12.1%) and having not knowing anyone who does those sorts of things (11.9%) are the least popular options.
Whatever we may find when observing the factors that are related to non-involvement with politics, it is important to pay attention to people’s own explanations. These are the barriers to political involvement that are important to them, and they relate first and foremost to practical constraints such as time and money (as predicted by Verba, Schlozman and Brady’s important Civic Voluntarism Model). Secondary but still important are perceptions of politics as inaccessible, in terms of requiring greater confidence than many people have or being for other sorts of people. These practical and perceived barriers gain additional significance because, as Figure 2 (using weighted data) shows, half of respondents (50.5%) give only one reason for their non-involvement. Further, more than four fifths of respondents give between one and three reasons, meaning that people tend to cite a small number of critical factors as the reasons for their non-involvement. However, when asked to rank the reasons in terms of importance, there is no stand-out answer that is ranked first by most people who selected it.

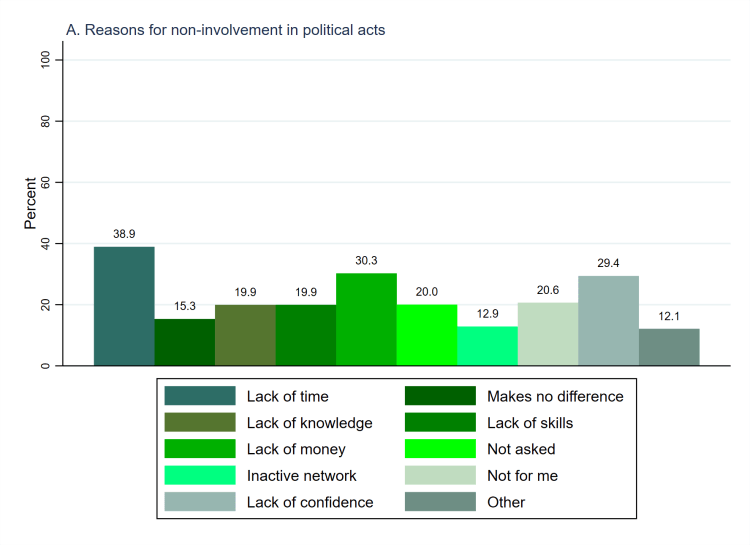
The answers presented in figures 1 and 2 are pooled across respondents who undertake no political acts, are not involved in organisation in any way, or both. The people who don’t do political acts (n = 188) still support organisations, and the people who don’t support organisations (n = 192) still did political acts, whilst both groups are distinct from those who neither do political acts nor get involved in groups (n = 125). It is worth observing the differences between the reasons that these groups give for their non-involvement, as shown in Figure 3 (using weighted data). Amongst people who do no political acts (panel A), lack of time (38.9%) was the most commonly cited reason followed by lack of money (30.9%) and lack of confidence (29.4%). By contrast, lack of confidence is less commonly cited (13.1%) as a reason for not getting involved in organisations (panel B), whilst lack of money (44.0%) and lack of time (38.7%) are the first and second most popular reasons. Finally, amongst people who undertake no political acts and have no involvement with organisations, lack of money is again the most popular reason (35.2%) but is followed by lack of confidence (27.4%) and lack of time (25.7%). Thus, lack of money and time are important barriers to both political acts and involvement in organisations but stand out as particularly important in the latter case. By contrast, although less important than those practical considerations, lack of confidence seems to be particularly relevant to not undertaking political acts. This suggests that explicitly political acts are seen as a domain reserved for people with particular skills or qualities.


| Variable names | pp_ni_time_b, pp_ni_nodiff_b, pp_ni_knowledge_b, pp_ni_skills_b, pp_ni_money_b, pp_ni_notasked,_b pp_ni_network_b, pp_ni_notforme_b, pp_ni_confidence_b, pp_ni_other_b |
| Number of cases | 505 |
| Number of categories | 2 |
| Categories to code as missing | None |
| Cases to code as missing | None |
| Recoded variable names | pp_ni_count |
| Number of cases | 505 |
| Number of categories | 9 |
| New and old categories | Category 1 (‘Yes’) on each of the original variables was counted as 1 (i.e. that reason for non-involvement is given), with category 0 (‘No’) counted as zero. As such, 1 on the new variable indicates one reason for non- involvement whilst 9 indicates that nine of the ten reasons for non-involvement are cited. |

2 thoughts on “Survey Variable: Selected Reasons for Non-Involvement”