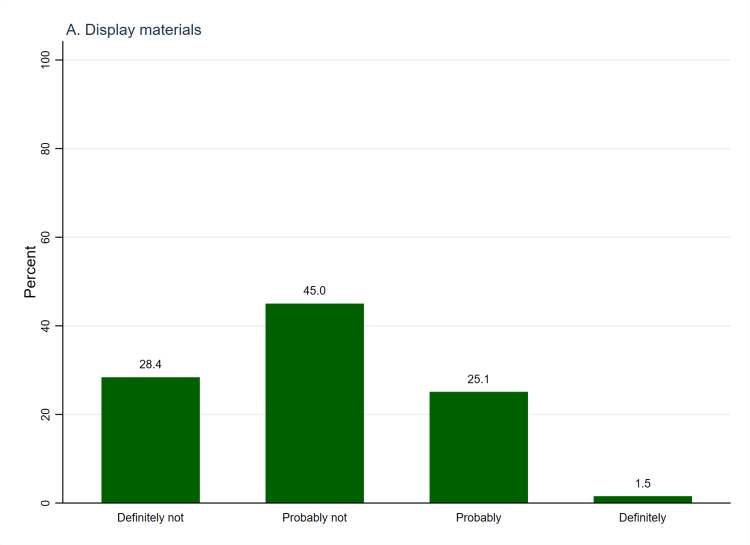
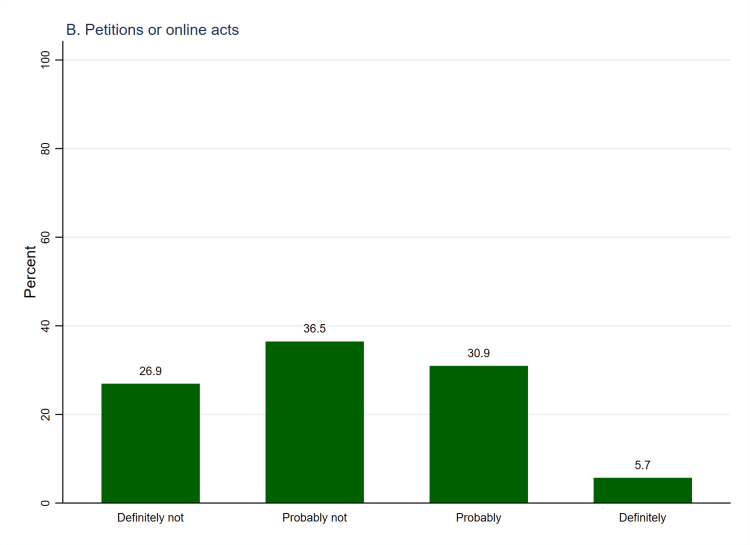

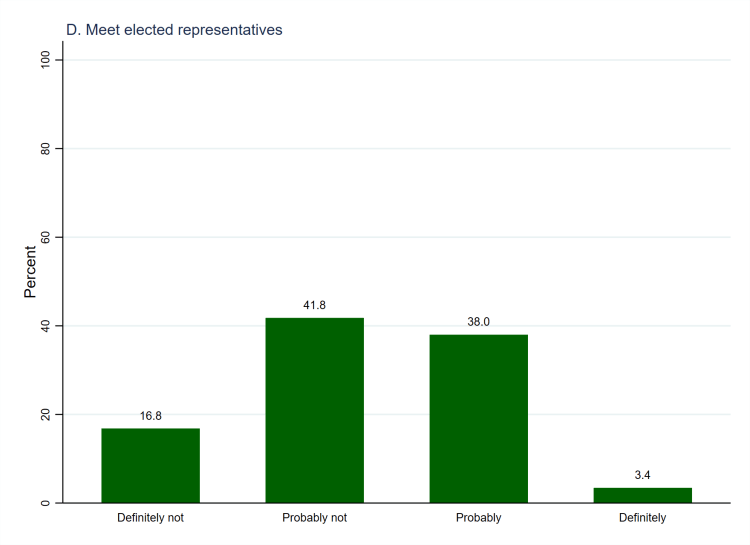
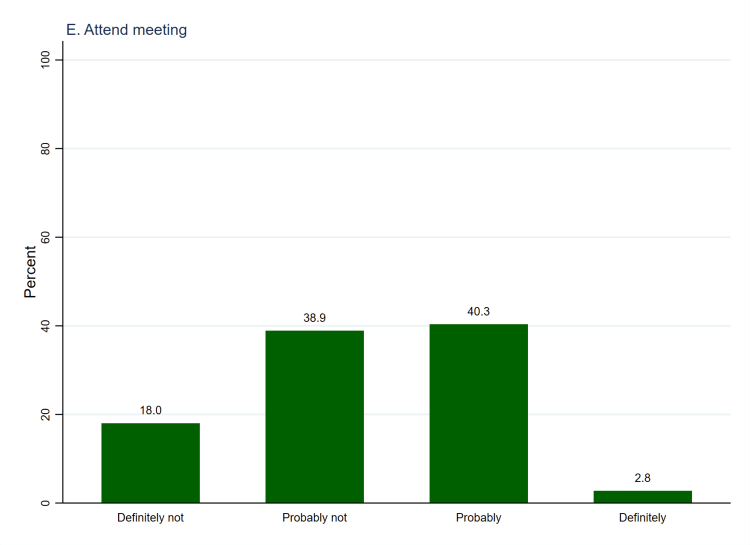
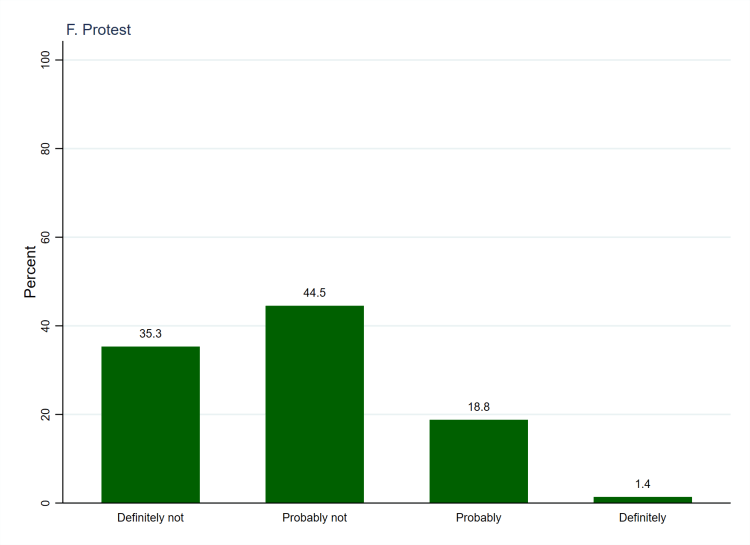
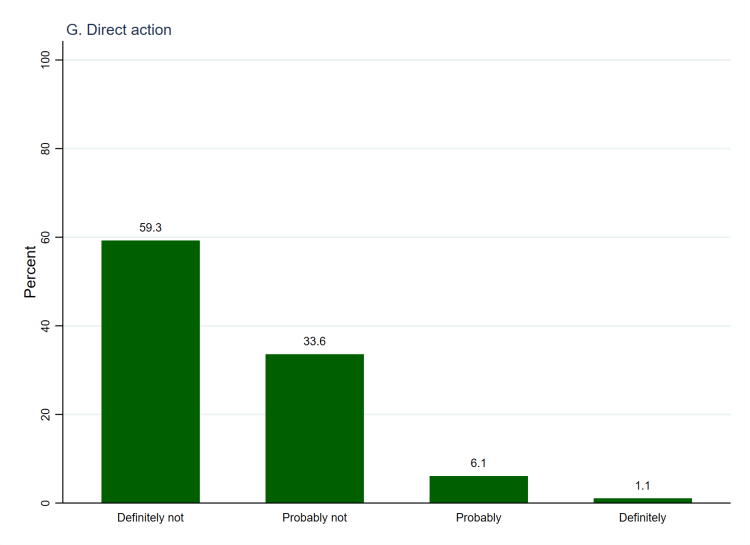
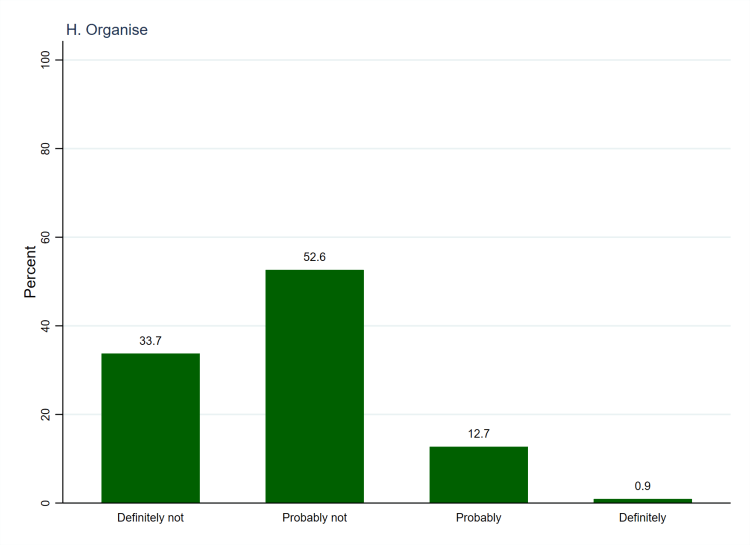
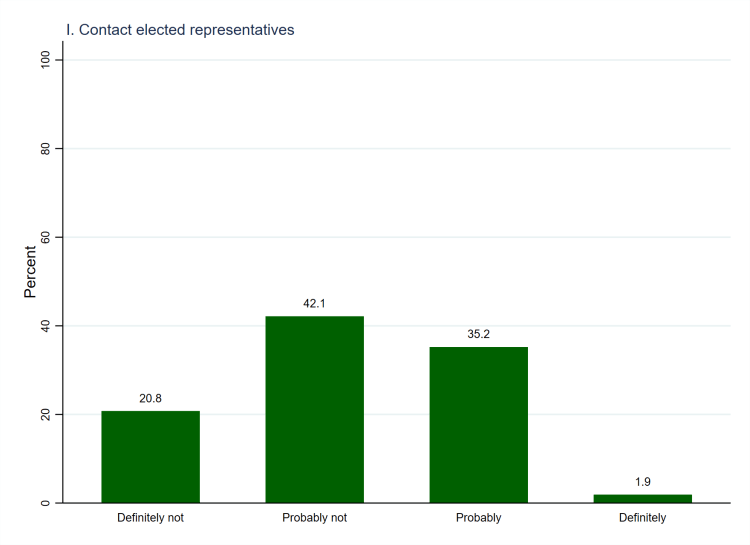
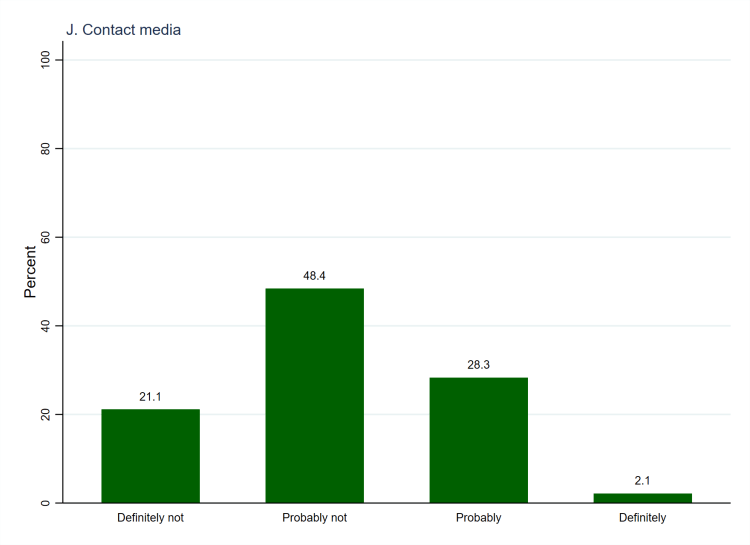

Respondents who said that they had never done each of the political acts that they were asked about were subsequently asked whether they would do those acts in future (in relation to an issue that was important to them). As such, each of the panels in Figure 1 (above), which uses weighted data, shows answers from respondents who never do those things.[1] The most favourably viewed possible act is attending a meeting (43.1% indicate that they would definitely or probably do so), followed closely by meeting an elected representative (41.4%) and contacting elected representatives (37.1%). All three of these possible acts are traditional and institutionalised forms of political activity whilst, by contrast, the least favourably viewed possible act is direct action (92.9% indicate that they would definitely or probably not do it), which is the most radical and risky form of political activity (as well as the least undertaken). Overall, then, amongst those who indicate that they have not done each of the acts in the past, there is no majority who say that they would do so in future. In other words, most of those who have not undertaken an act also have no, or no strong, intention of doing so in future.
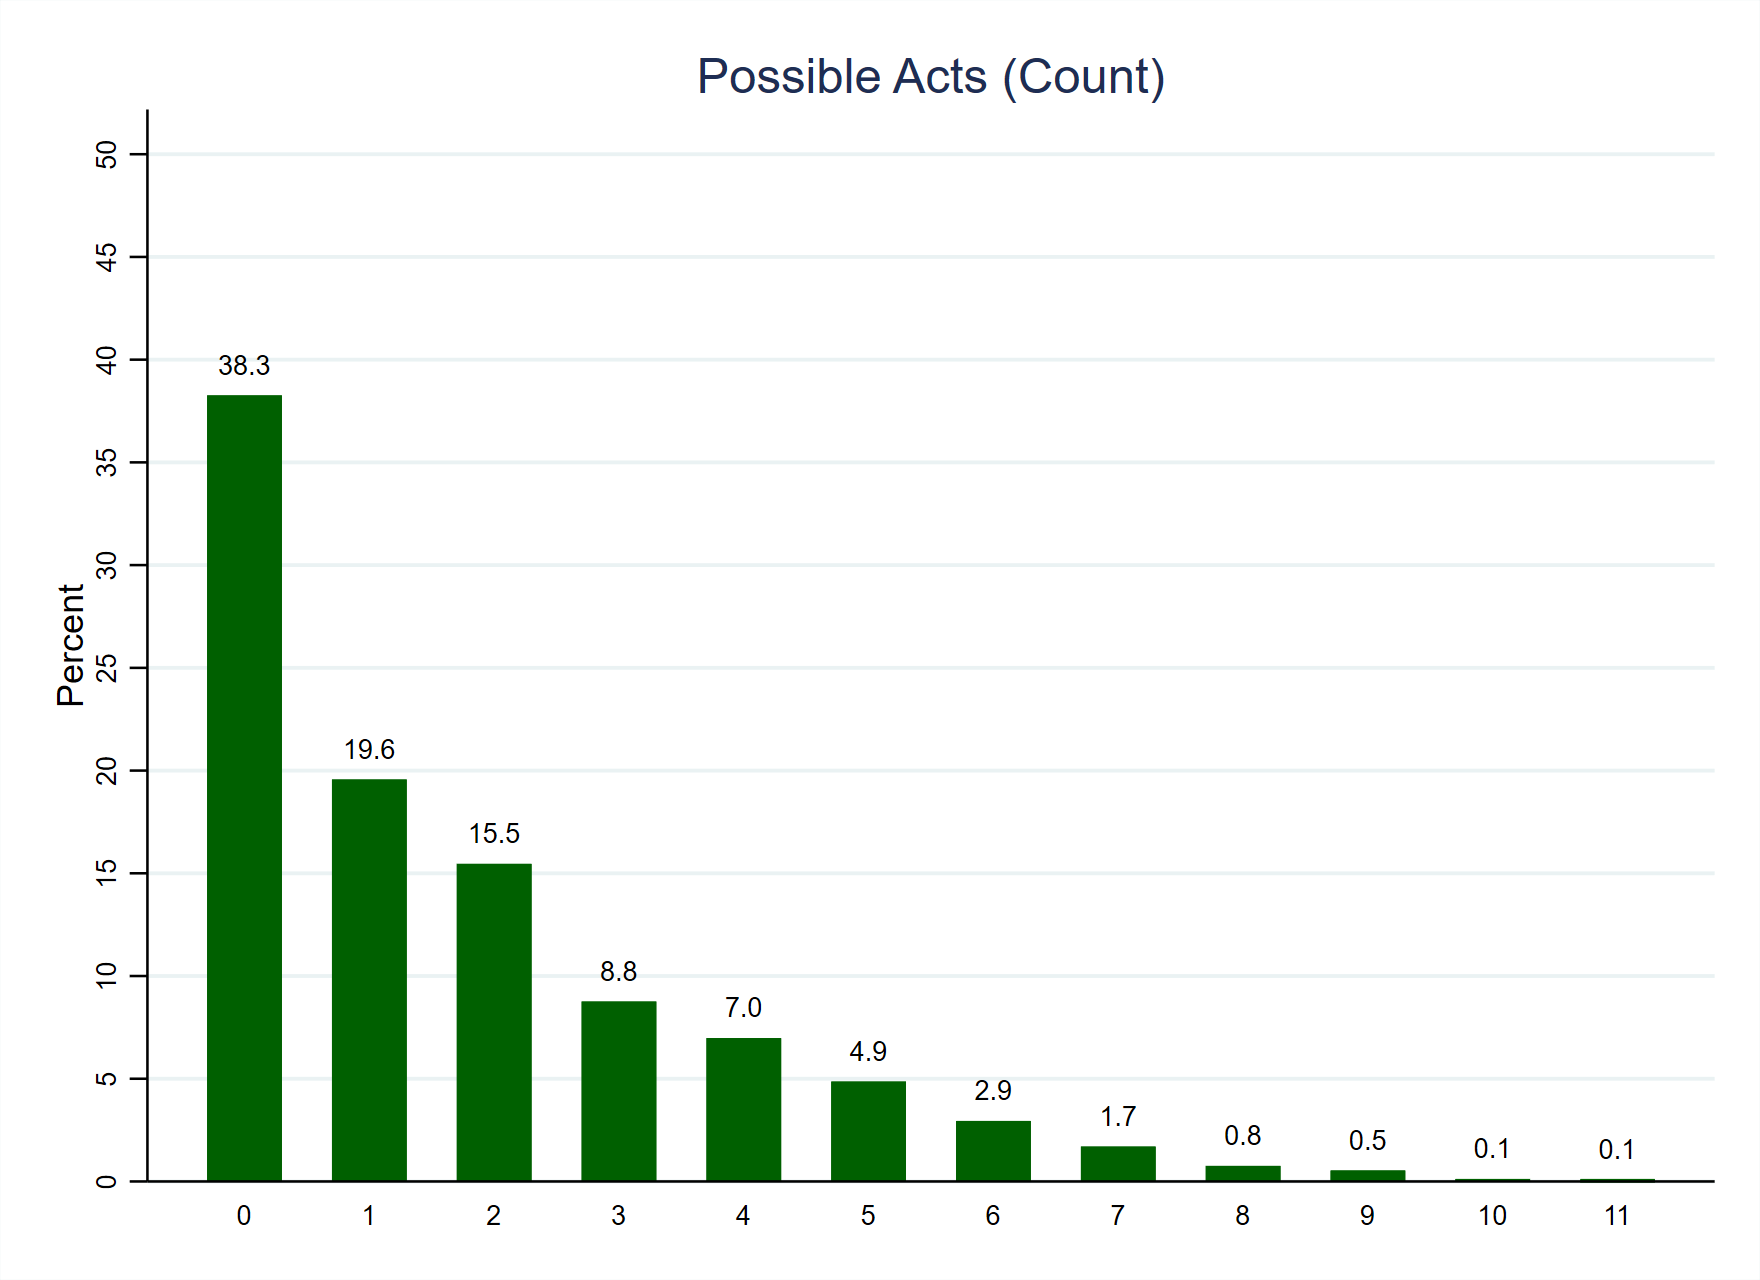
Additionally, as with official positions and political acts, we can summarise the above eleven separate variables into a count variable indicating how many acts (that they have not already done) respondents would do in future. In order to do so, the number of acts that respondents said they would ‘Probably’ or ‘Definitely’ do were counted (with ‘Probably not’ and ‘Definitely not’ answers counted as zeros). As can be seen in Figure 2 (below), which again uses weighted data, a majority (57.9%) would undertake zero acts or only one act that they have not already done. Together with Figure 1, this indicates that those who have not undertaken particular political acts tend to be disinclined to undertake them in future. As an indication of this, a majority (52.9%) have undertaken four or fewer political acts, but a very small percentage (3.2%) indicate that they would undertake the remaining seven or more acts that they have not already done. This suggests that there may not have been a large untapped pool of potential political activists in pre-Brexit Britain. However, as noted in relation to political acts undertaken previously, we should read these estimates with caution because survey respondents, and especially those drawn from voluntary online panels, tend to be disproportionately politically active. This means, of course, that we may also not have accurate estimates of political inactivity.
| Variable names | pp_pap_materials_irmv, pp_pap_petitonlin_irmv, pp_pap_boycott_irmv, pp_pap_meetelecrep_irmv, pp_pap_attmeet_irmv, pp_pap_protest_irmv, pp_pap_directact_irmv, pp_pap_orgmeegro_irmv, pp_pap_contpol_irmv, pp_pap_contmed_irmv, pp_pap_urge_irmv |
| Number of cases | 878, 270, 518, 920, 676, 1,036, 1,339, 1,235, 653, 860, 811 |
| Number of categories | 4 |
| Categories to code as missing | None |
| Cases to code as missing | None |
| Recoded variable name | pp_pap_count |
| Number of cases | 1,371 |
| Number of categories | 12 |
| New and old categories | Categories 3 (‘Probably’), and 4 (‘Definitely’) on each of the original variables were counted as 1 (i.e. indicating that they would do the act), with categories 0 (‘Definitely not’) and 1 (‘Probably not’) counted as zero. As such, 0 on the new variable indicates that none of the acts that have not already been done are likely to be done in future, whilst 11 indicates that none of the acts have already been done but they might be so in future. |
[1] The weighted and unweighted numbers behind Figure 1 can be found in Table 1A.

One thought on “Survey Variable: Possible Political Acts”