
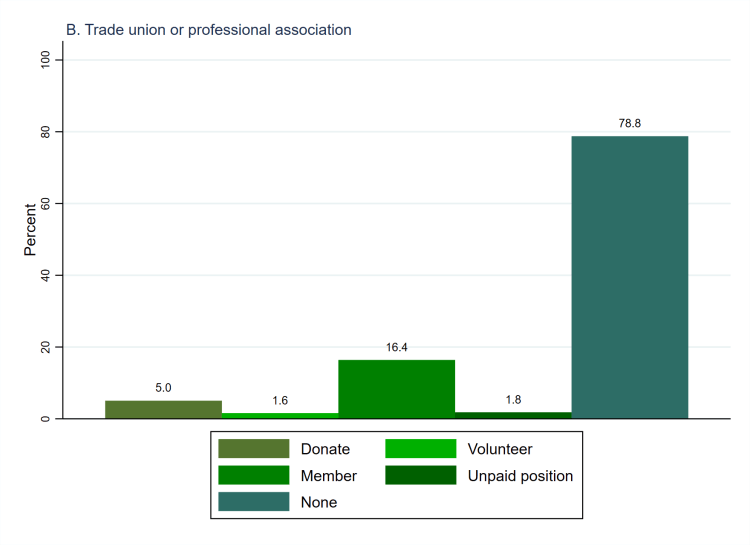

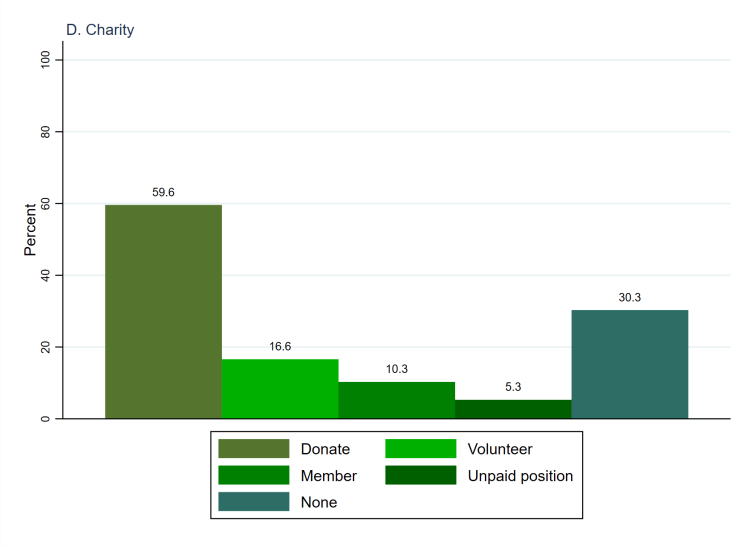
Beyond specific political acts, whether already done or prospective, people can have longer-term relationships with organisations that are more or less explicitly political in nature. Specifically, the survey asked about donating, volunteering, membership, and holding unpaid positions. As Figure 1 (above) shows, those activities were asked about in relation to political parties (panel A), trade unions and professional associations (panel B), campaign organisations (panel C), and charities (panel D).[1] For all types of organisation except charities, four fifths or more of respondents indicate that they are not involved in any of the ways asked about. Indeed, with the exception of being a member of a trade union or professional association (16.9%), less than one in ten people get involved in those ways. By contrast, less than one third (30.3%) of people indicate that they do not get involved with charities, and a majority (59.6%) indicate that they donate to such organisations. Charities are the least explicitly political organisations that the survey asked about (though this varies between organisations), so it seems that people are more inclined to support less overtly political causes.
Again, we can look at the data differently by counting the number of ways that people are involved with each type of organisation. The results of doing so are shown in Figure 2 (below, using weighted data) and tell a similar story.[2] Of course, the percentages who are not involved with each type of organisation are identical in both figures, but we can also see that most people who get involved only do so in one way. The percentages who get involved in two or more ways are very small for political parties (2.7%, panel A), trade unions and professional associations (2.5%, panel B), and campaign organisations (3.1%, panel C). Even for charities (panel D), around one in seven (14.4%) get involved in two or more ways despite the fact, noted above, that a majority of people donate to charities. Given that the survey sample is likely to over-represent people who are active in more or less explicitly political activities, these results indicate that a very small percentage of the population are actively involved in any organisations other than charities, and especially in terms of getting involved in multiple ways. This may be, in part, because the kinds of involvement asked about entail a greater commitment of time or money to an organisation than specific political acts asked about previously.

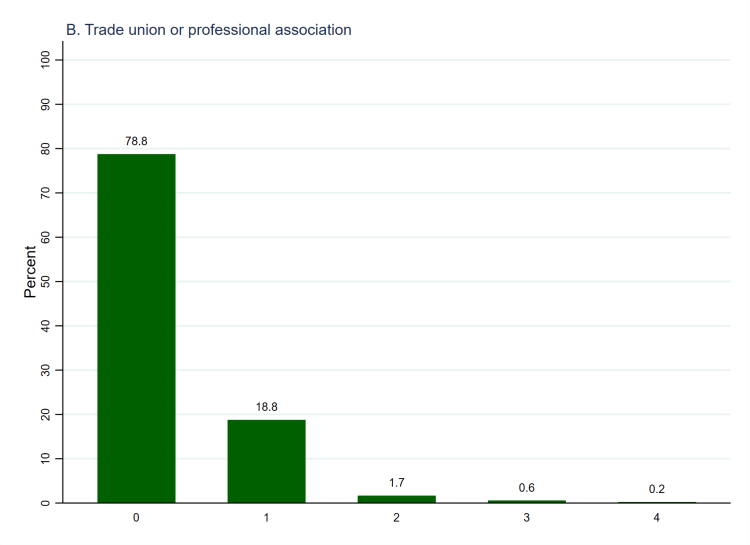
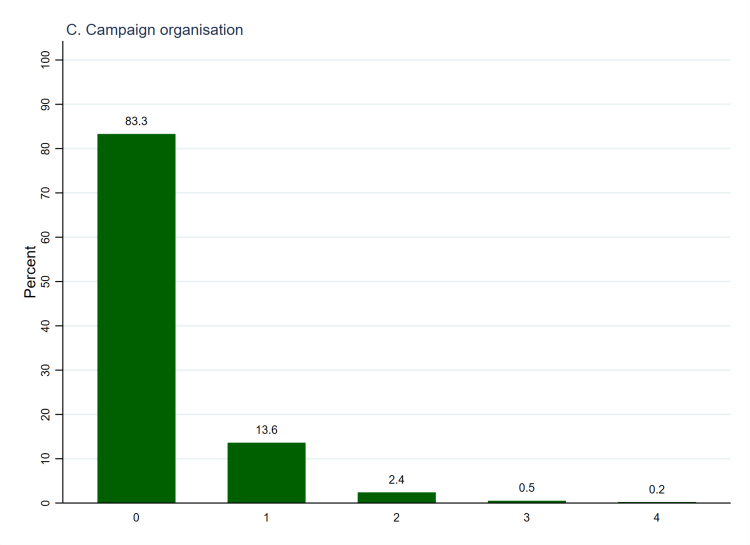

| Variables names | pp_gi_pp_1b, pp_gi_pp_2b, pp_gi_pp_3b, pp_gi_pp_4b pp_gi_pp_5b pp_gi_tupa_1b, pp_gi_tupa_2b pp_gi_tupa_3b pp_gi_tupa_4b, pp_gi_tupa_5b pp_gi_co_1b pp_gi_co_2b, pp_gi_co_3b pp_gi_co_4b pp_gi_co_5b, pp_gi_char_1b pp_gi_char_2b pp_gi_char_3b, pp_gi_char_4b pp_gi_char_5b |
| Number of cases | 1,405 |
| Number of categories | 2 |
| Categories to code as missing | None |
| Cases to code as missing | None |
| Recoded variable names | pp_gi_pp_count, pp_gi_tupa_count, pp_gi_co_count, pp_gi_char_count |
| Number of cases | 1,405 |
| Number of categories | 5 |
| New and old categories | Category 1 (‘Yes’) on each of the original variables was counted as 1 (i.e. that type of involvement is undertaken), with category 0 (‘No’) counted as zero. As such, 0 on the new variables indicate no involvement with that type of organisation whilst 4 indicates involvement in all 4 of the ways asked about. |
[1] The weighted and unweighted numbers behind Figure 1 can be found in Table 1A.
[2] The weighted and unweighted numbers behind Figure 2 can be found in Table 2A.

7 thoughts on “Survey Variable: Organisation Involvement”