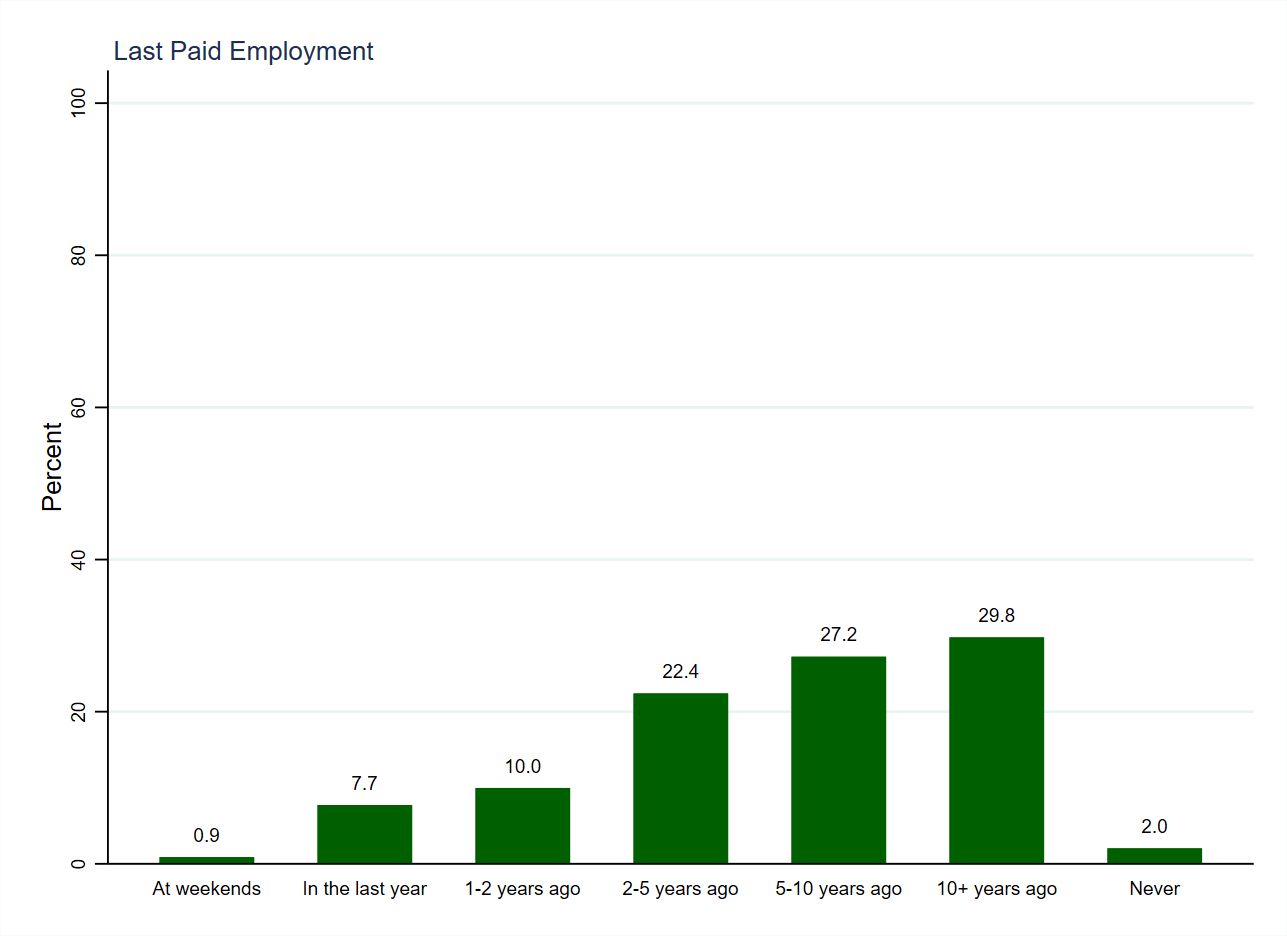
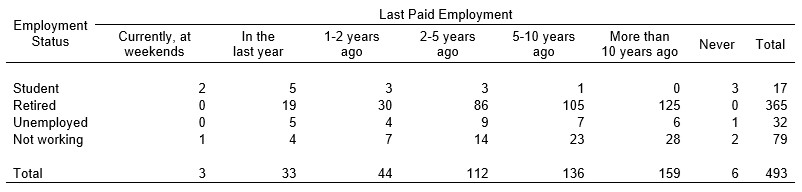
Respondents who indicated that they don’t do any hours of paid work on an average weekday (n = 493) were asked when they last had paid employment. As Figure 1 (above, using weighted data) shows, a majority of these respondents have not had work for at least five years (57.0%). A further two fifths (40.1%) have ceased to work in the last five years, and only a tiny proportion have never worked (2.0%) or only work at weekends (0.9%). Breaking these respondents down into their employment status, as Table 1 (below, using unweighted data) shows, we can see that almost three quarters of them (74.0%) are retired. The next largest group is people who are not working (16.0%), who may be stay-at-home parents or homemakers. Finally, a tenth of those who do not have paid employment during the week are unemployed (6.5%) or students (3.5%).
| Variable name | back_anywork_mv |
| Number of cases | 493 |
| Number of categories | 7 |
| Categories to code as missing | None |
| Cases to code as missing | None |
