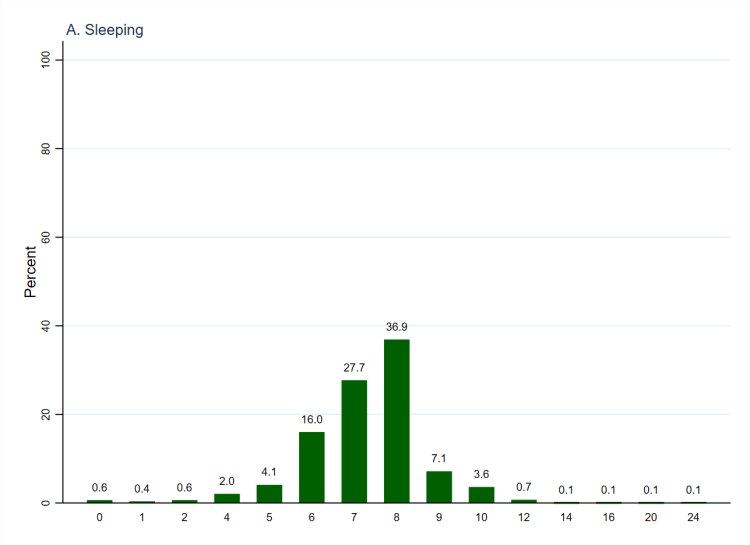
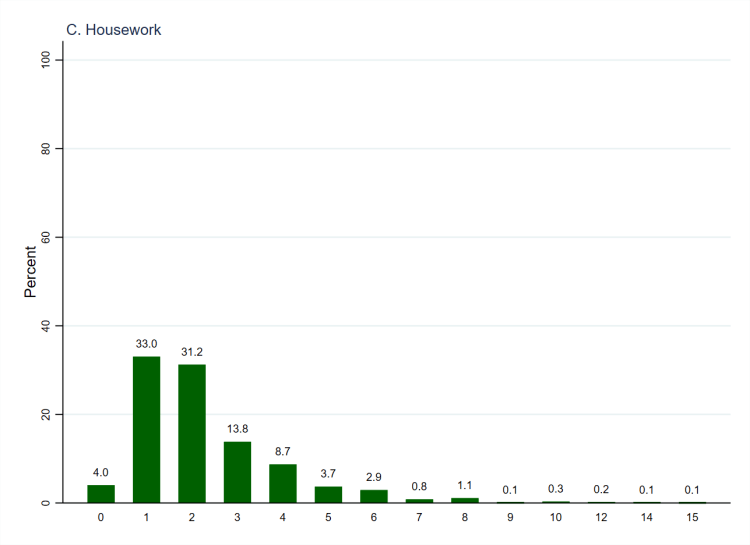

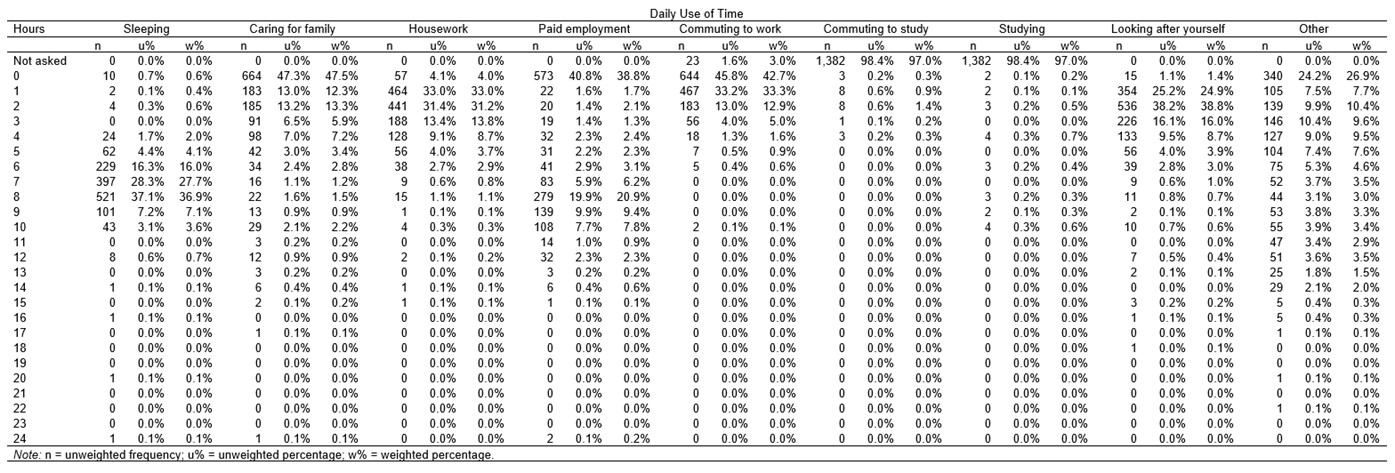
Respondents were asked to indicate approximately how long they spend on a range of common activities during an average weekday. Specifically, they were asked to indicate roughly how many hours they spend sleeping, caring for family, doing housework, doing their job, commuting to work, commuting to study (if applicable), studying (if applicable), looking after themselves (e.g. eating, showering, exercising), and doing other things. Their answers for each activity had to add up to 24 hours, and Figure 1 (above, using weighted data) shows the distributions of answers.[1] Most people (87.7%) sleep between six and nine hours per day (panel A), and this is the activity with the highest modal category (since everybody needs to sleep, regardless of their circumstances). This is followed by other activities that everyone needs to do: looking after yourself (panel H), which most people (79.6%) spend between one and three hours a day on; and housework (panel C), which most people (64.2%) spend one or two hours on.
Respondents were asked to indicate approximately how long they spend on a range of common activities during an average weekday. Specifically, they were asked to indicate roughly how many hours they spend sleeping, caring for family, doing housework, doing their job, commuting to work, commuting to study (if applicable), studying (if applicable), looking after themselves (e.g. eating, showering, exercising), and doing other things. Their answers for each activity had to add up to 24 hours, and Figure 1 (above, using weighted data) shows the distributions of answers.[1] Most people (87.7%) sleep between six and nine hours per day (panel A), and this is the activity with the highest modal category (since everybody needs to sleep, regardless of their circumstances). This is followed by other activities that everyone needs to do: looking after yourself (panel H), which most people (79.6%) spend between one and three hours a day on; and housework (panel C), which most people (64.2%) spend one or two hours on.
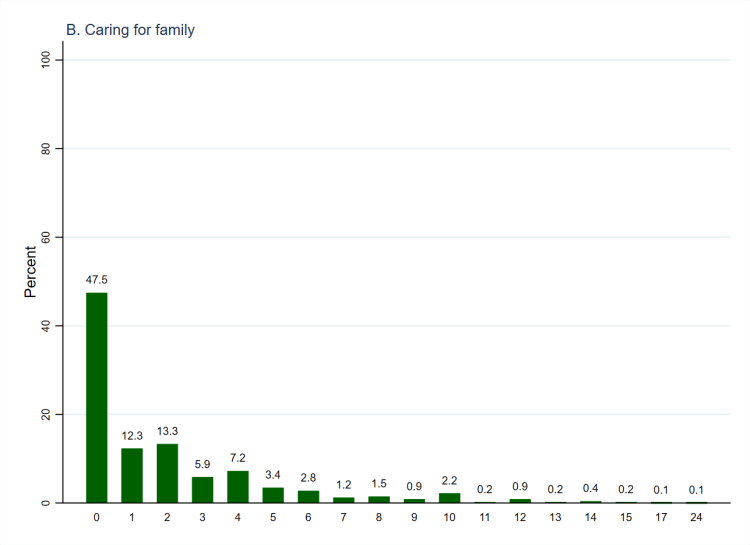
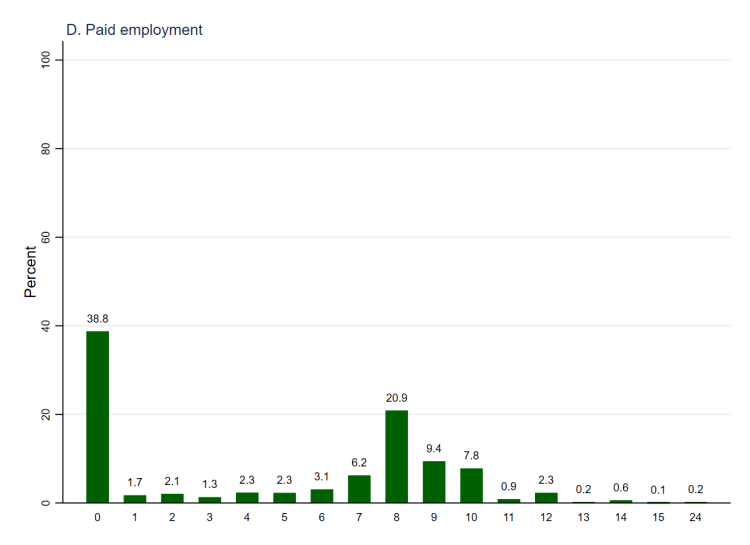
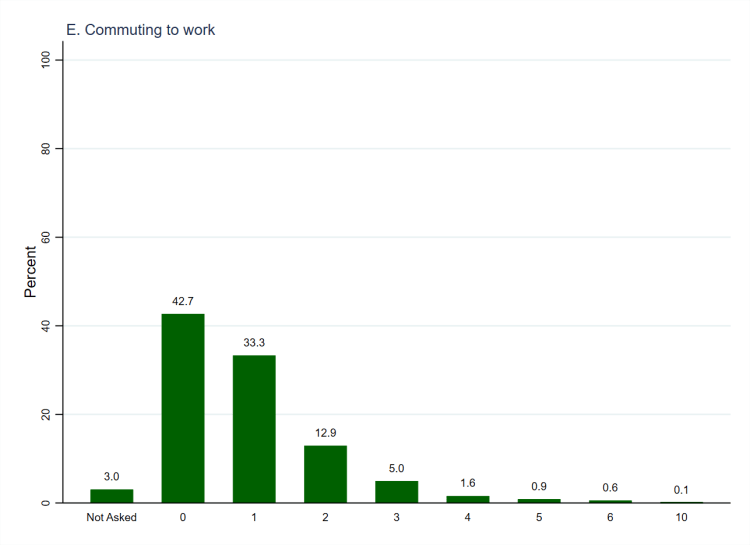
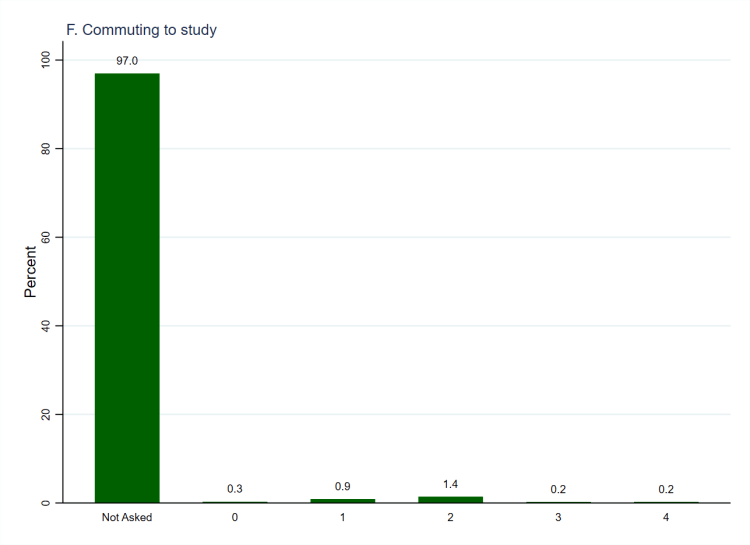
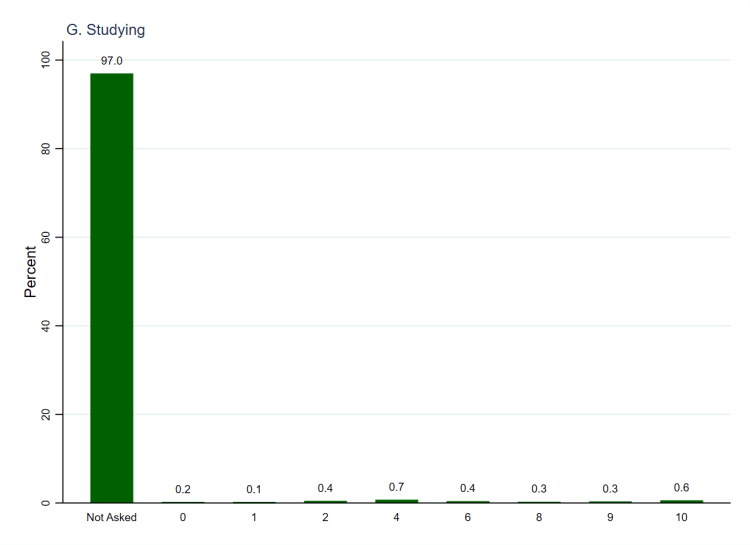
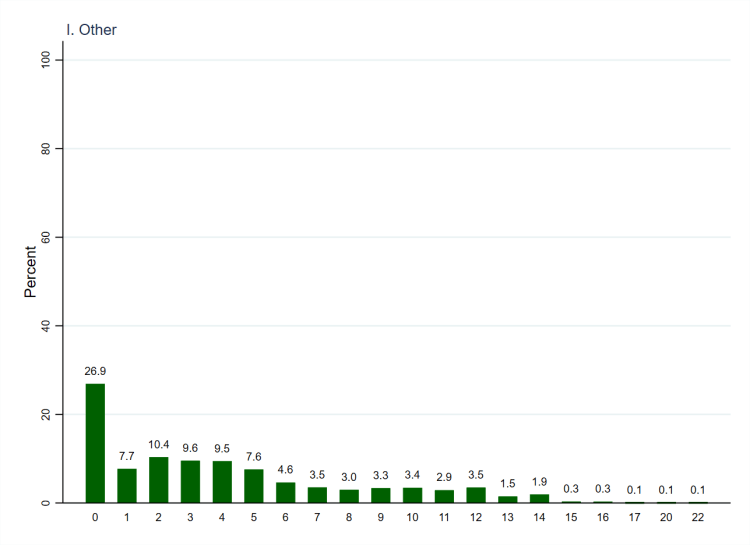
By contrast, almost half (47.5%) of respondents indicate that they spend no time caring for family (panel B) on an average weekday, in all likelihood because they do not have children or have children who have left home, and have no caring responsibilities for other relatives. Slightly more than a third of respondents (38.8%) indicate that they spend no time in paid employment (panel D), suggesting that they are retirees, stay-at-home parents or carers, look after the home, or unemployed. The percentage of people who spend no time commuting to work (42.7%, panel E) is slightly higher than the percentage who do not work, indicating that some people work from home or very close to home. Only respondents who had already indicated that they were students (n = 23) were asked about studying (panel G) and commuting to study (panel F), which is why the vast majority of respondents (97.0%) were not asked about these activities. Finally, time left over after these common daily activities is represented by the ‘Other’ category (panel I), which a plurality (26.9%) indicate they have no time for on an average weekday. The distribution is otherwise quite flat and a majority of people (52.8%) spend somewhere between one and seven hours on other activities during an average weekday.
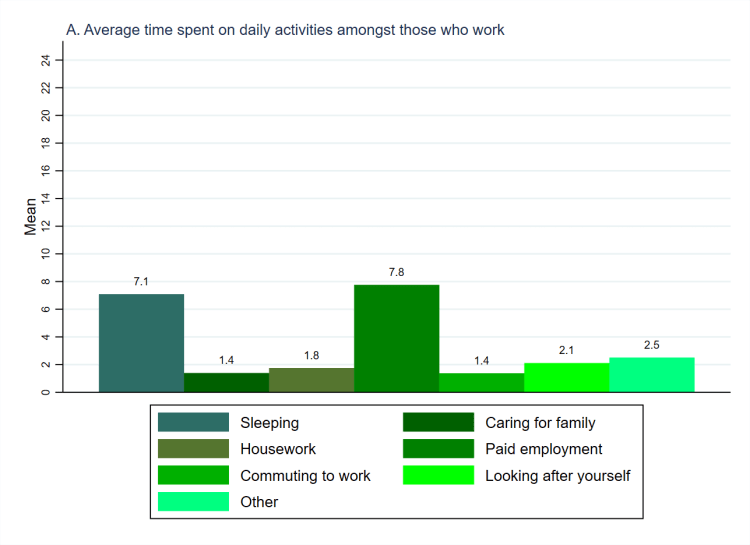
We can also look at the average time spent on each activity, as presented in Figure 2 (below, using weighted data), which shows the figures for people who work (panel A) and people who do not (panel B) separately.[2] Amongst those who work, the two highest averages are, unsurprisingly, time spent on paid employment (7.8 hours) and sleep (7.1 hours). Those who do not work have higher averages across all other activities; they spend twice as much time (2.8 hours rather than 1.4) caring for family, almost twice as much time doing housework (3.2 hours rather than 1.8), and just over an hour more looking after themselves (3.3 hours rather than 2.1). Most striking is the amount of time that they have for other activities, which is more than two and a half times higher than for those who work (6.5 hours rather than 2.5 hours). We might think of this as spare time, which is important to consider when looking at the factors that shape whether and how people get involved in politics. This is especially the case since lack of time is one of the most commonly cited reasons for not getting involved.

| Variable names | ec_time_sleep, ec_time_caring, ec_time_housework, ec_time_paidwork, ec_time_commutwork, ec_time_commutstud, ec_time_study, ec_time_self, ec_time_other |
| Number of cases | 1,405 |
| Number of categories | 24 |
| Categories to code as missing | None |
| Cases to code as missing | None |
[1] Full numbers, unweighted percentages, and weighted percentages can be found in Table A1.
[2] The categories relating to studying and commuting to study are excluded because such a small number of respondents are students.

One thought on “Survey Variable: Daily Use of Time”