There are many different facets of economic capital but one of the key distinctions is between income and wealth. The former is the amount of money that one receives each year, be it from a wage, a pension, or investments. By contrast, the latter covers the accumulated assets that one holds, be they in the form of savings, property, stocks and shares, art, or anything else. Whilst they are clearly related, not least in the sense that higher income tends to lead to the accumulation of greater wealth, income and wealth may not always be closely linked. For instance, a retiree who bought a house in the South East of England in the 1960s and now lives on the income from a modest pension may have considerable wealth but a relatively low income. For this reason, the survey measured multiple indicators of economic capital, including income and elements of wealth.
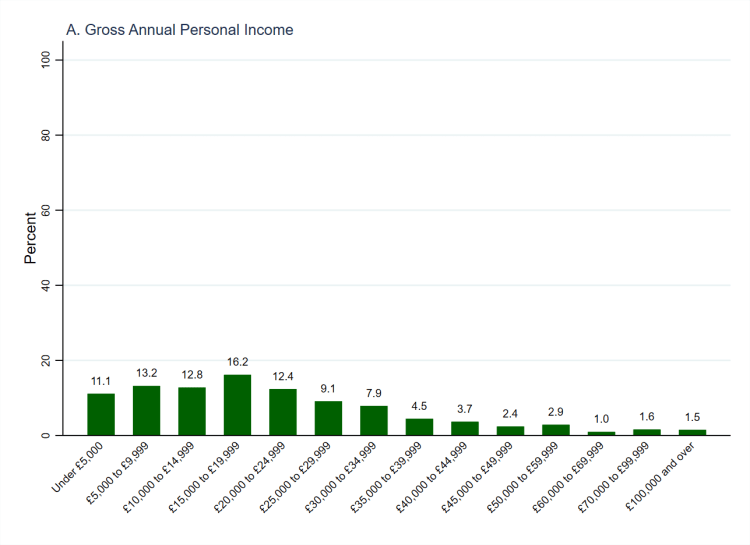
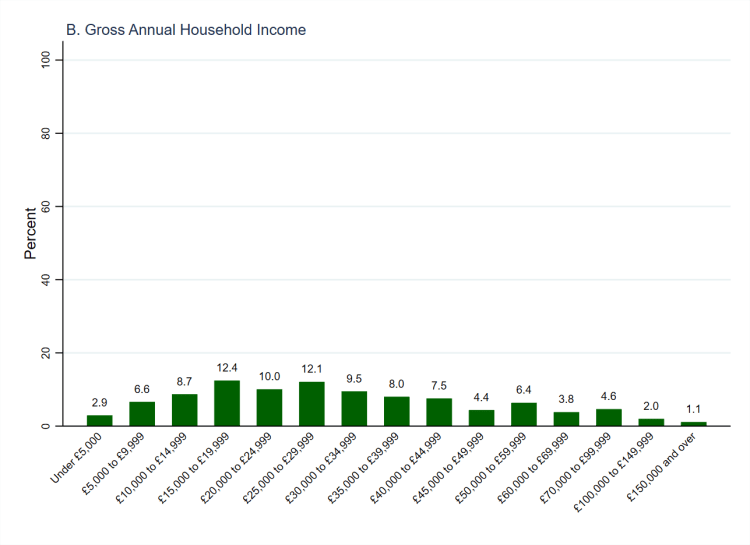
Within income, we can distinguish between what one earns personally, and the total amount earned within a household. The latter allows us to take account of the fact that someone may not earn an income personally but can still have access to considerable economic capital due to a large household income (e.g. if someone shares the income of a partner). The survey asked about both personal and household income, and the distributions of each can be seen in Figure 1 (above, using weighted data). More than half of people (53.3%) have gross annual personal incomes (panel A) below £20,000, and the modal category is ‘£15,000 to £19,999’ (selected by 16.2%).[1] By contrast, household income (panel B) tends to be slightly higher, reflecting the fact that it can encompass multiple personal incomes.[2] We have to add all of the categories up to ‘£25,000 to £29.999’ together in order encompass half of people (52.7%). Further, the tail to the right of the distribution for household income, encompassing the higher categories of income, is longer and flatter than for personal income. Thus, unsurprisingly, people tend to have higher household than personal incomes.
There is, however, a crucial caveat relating to income variables: people are often unwilling to provide information on their incomes, and income is viewed as a sensitive topic. For this reason, we see very high numbers of non-responses on both income variables: from a total sample of 1,405, 308 did not provide an answer in relation to personal income, and 343 did not provide an answer in relation to household income. This may be because they are uncomfortable providing the information or because they are not able to provide an accurate answer (especially in relation to household income, which may entail knowing multiple people’s incomes). Whatever the reasons, between a fifth and a quarter of respondents did not provide information about their incomes so we can be less confident of the distribution of this facet of economic capital than we are about other facets for which we have answers from all respondents.
| Variable names | ec_persinc, ec_housinc |
| Number of cases | 1,405 |
| Number of categories | 16-17 |
| Categories to code as missing | ec_persinc: 15 (‘Don’t know’) and 16 (‘Prefer not to answer’) ec_housinc: 16 (‘Don’t know’) and 17 (‘Prefer not to answer’) |
| Cases to code as missing | 308-343 |
| Recoded variable name | ec_incagp_mv, ec_incagh_mv |
| Number of cases | 1,097-1,062 |
| Number of categories | 14-15 |
| New and old categories | The substantive categories indicating incomes remain the same in the new, recoded variables. However, in both new variables, the ‘Don’t know’ (15 or 16) and ‘Prefer not to say’ (16 or 17) categories are coded as missing. |

2 thoughts on “Survey Variable: Income”