As mentioned when considering income, that concept needs to be distinguished from wealth, which is the assets that one holds (less one’s liabilities). Assets might take the form of savings, investments, art or, most commonly, property. The latter was asked about in the survey, and respondents indicated whether they owned five types of property: residential (owned outright), residential (with a mortgage), buy-to-let, land, and commercial. Such assets constitute an important part (and often the bulk of) of people’s wealth, and we can assume that people who own more types of property are likely to be wealthier than people who own fewer types of property.
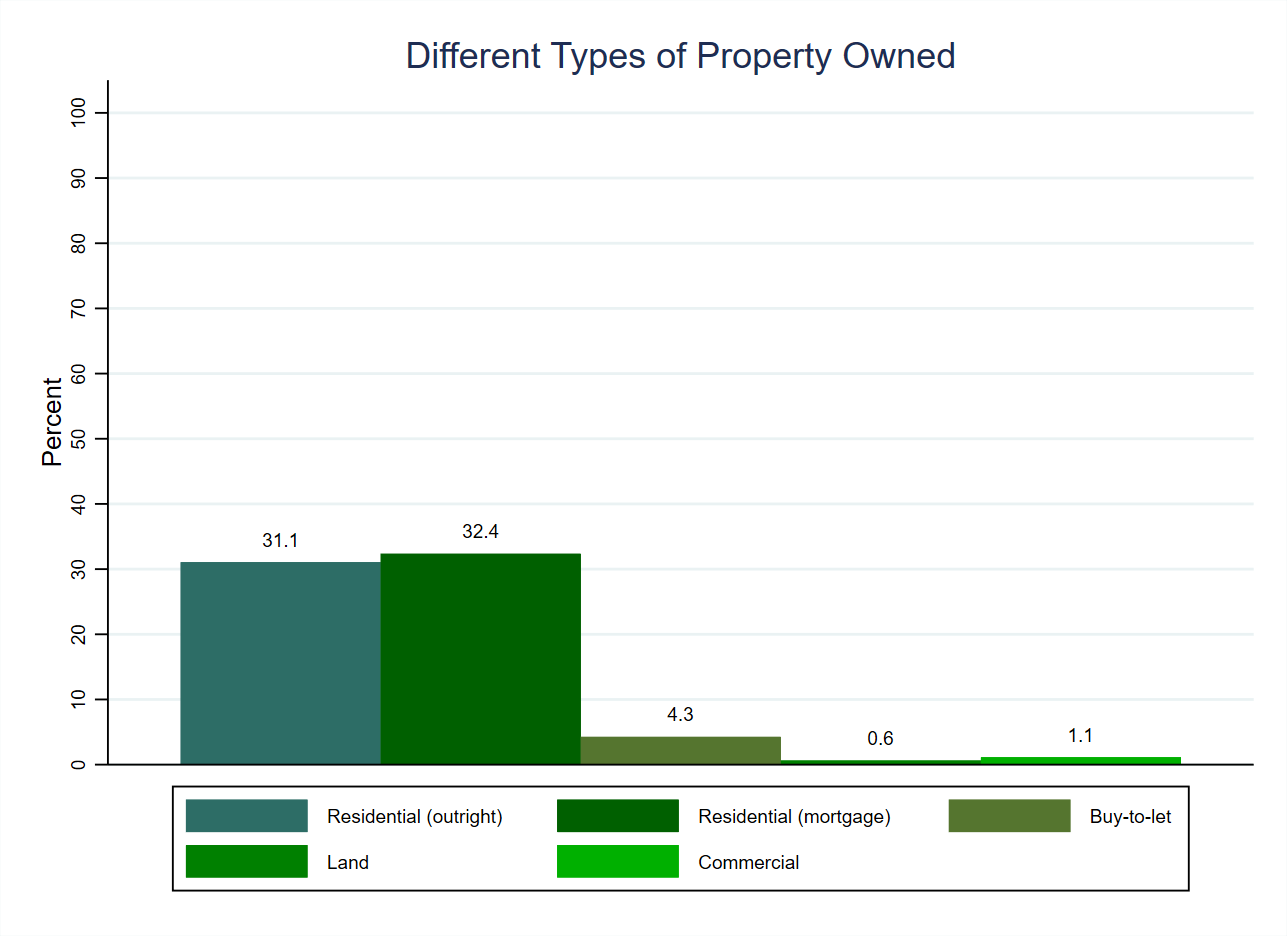
Figure 1 (above, using weighted data) shows that almost a third of people (32.4%) own a residential property with a mortgage, most likely the homes that they live in. A further three in ten (31.1%) own residential property with a mortgage, and we can again assume that these are likely to be their own homes. Ownership of properties for other purposes is far less common: fewer than one in twenty people (4.3%) own a buy-to-let property whilst slightly more than one in a hundred (1.1%) own commercial property, and an even smaller group (0.6%) own land. Thus, whilst home ownership is widespread, owning other types of property is much less common.
The rarity of owning property other than one’s home is also apparent when we look at how many types of property people own, as shown in Figure 2 (below, also using weighted data). More than three fifths of people (62.3%) own one type of property, whilst a further third (34.5%) own none, meaning that fewer than one in thirty (3.2%) own more than one type of property. In this light, we can safely assume that owning ‘investment property’ is not commonplace, and the vast majority of people can afford to buy one property or less. This suggests that most people’s wealth is tied up in the property that they reside in, and having property that one can simply sell to maximise returns is beyond the reach of most.

| Variable names | ec_property_resown, ec_property_resmort, ec_property_buytolet, ec_property_plotland, ec_property_commercial, ec_property_notsure, ec_property_none |
| Number of cases | 1,405 |
| Number of categories | 2 |
| Categories to code as missing | 1 (‘Yes’) on ec_property_notsure |
| Cases to code as missing | 9 |
| Recoded variable name | ec_propro_b, ec_proprm_b, ec_propbl_b, ec_proppl_b, ec_propco_b, ec_prop_c |
| Number of cases | 1,396 |
| Number of categories | 2 |
| New and old categories | People who selected ‘Yes’ (1) on the original ec_property_notsure variable (presented as the ‘Not sure’ option to respondents) were coded as missing on the new binary variables, which also replace 2 with 0 to represent the ‘No’ category. The responses to the new binary variables were then added together to create the new count variable (ec_prop_c). As such, a 0 on the count variable indicates that the respondent owns none of the types of property, whilst a 5 indicates that they own all of the types. |
