An important element of people’s political engagement and their perception of themselves is whether they identify with a political party and, if so, which. Party identity is a well-established concept within political science and has been argued to be a key driver of electoral behaviour, meaning that it is widely measured in political surveys. The Privilege and Participation Survey is no different, and asked people two questions about party identity: first, which party identify with (if any); second, to those people who said ‘none’ or ‘don’t know,’ which party they feel closer to (if any).
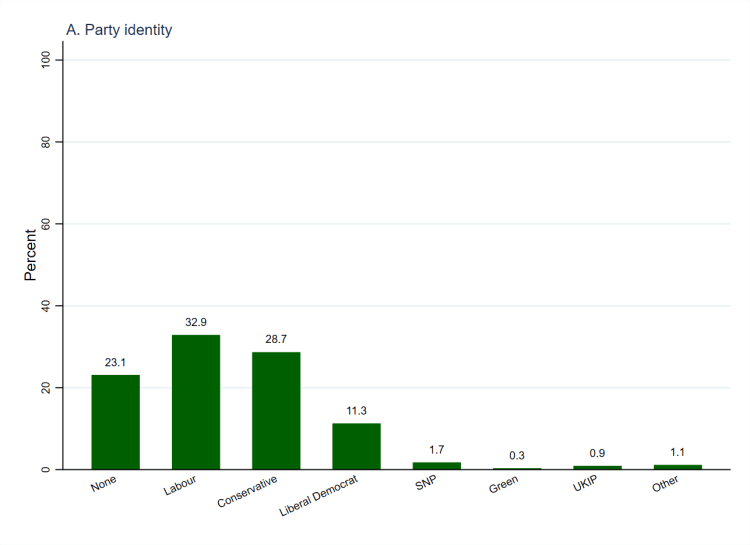
As Figure 1 (above, using weighted data) shows, a large majority of people, exceeding three quarters (76.9%), identify with a party (panel A), meaning that slightly less than a quarter (23.1%) do not.[1] The vast majority of those who identify with a party (72.9% of people overall) pick one of the established UK-wide parties: a third of people (32.9%) identify as Labour, just under three in ten (28.7%) as Conservative, and slightly more than one in ten (11.3%) as Liberal Democrat. This leaves only one in twenty-five (4.0%) who identify with smaller or non-UK-wide parties such as the SNP (1.7%), Greens (0.3%), and UKIP (0.9%).
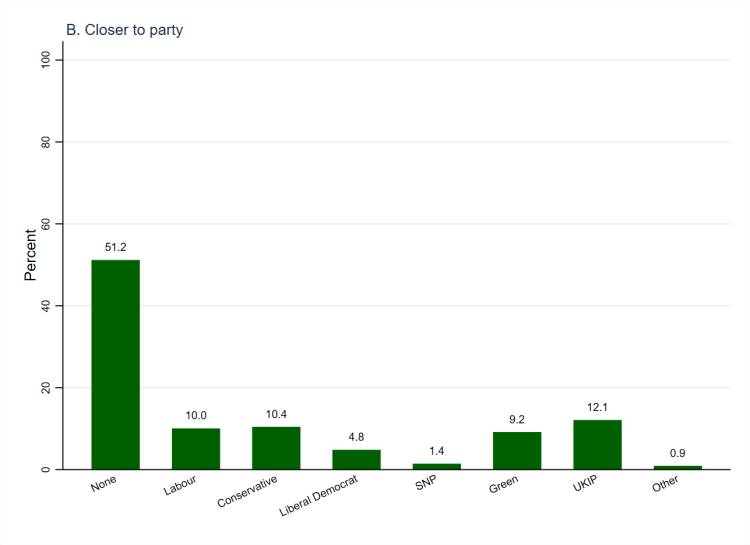
Amongst those who indicate no party identity or say that they don’t know what their party identity is (panel B), a majority (51.2%) say that they also do not feel any closer to any of the parties. This leaves slightly less than half (48.8%) who do feel closer to a party despite professing no party identity, the largest group of which (12.1% of those asked whether they feel closer to a party) choose UKIP. That group is closely followed by those who choose Conservative (10.4%), Labour (10.0%), and Green (9.2%), whilst smaller numbers indicate closeness to the Liberal Democrats (4.8%), SNP (1.4%), and other parties (0.9%).
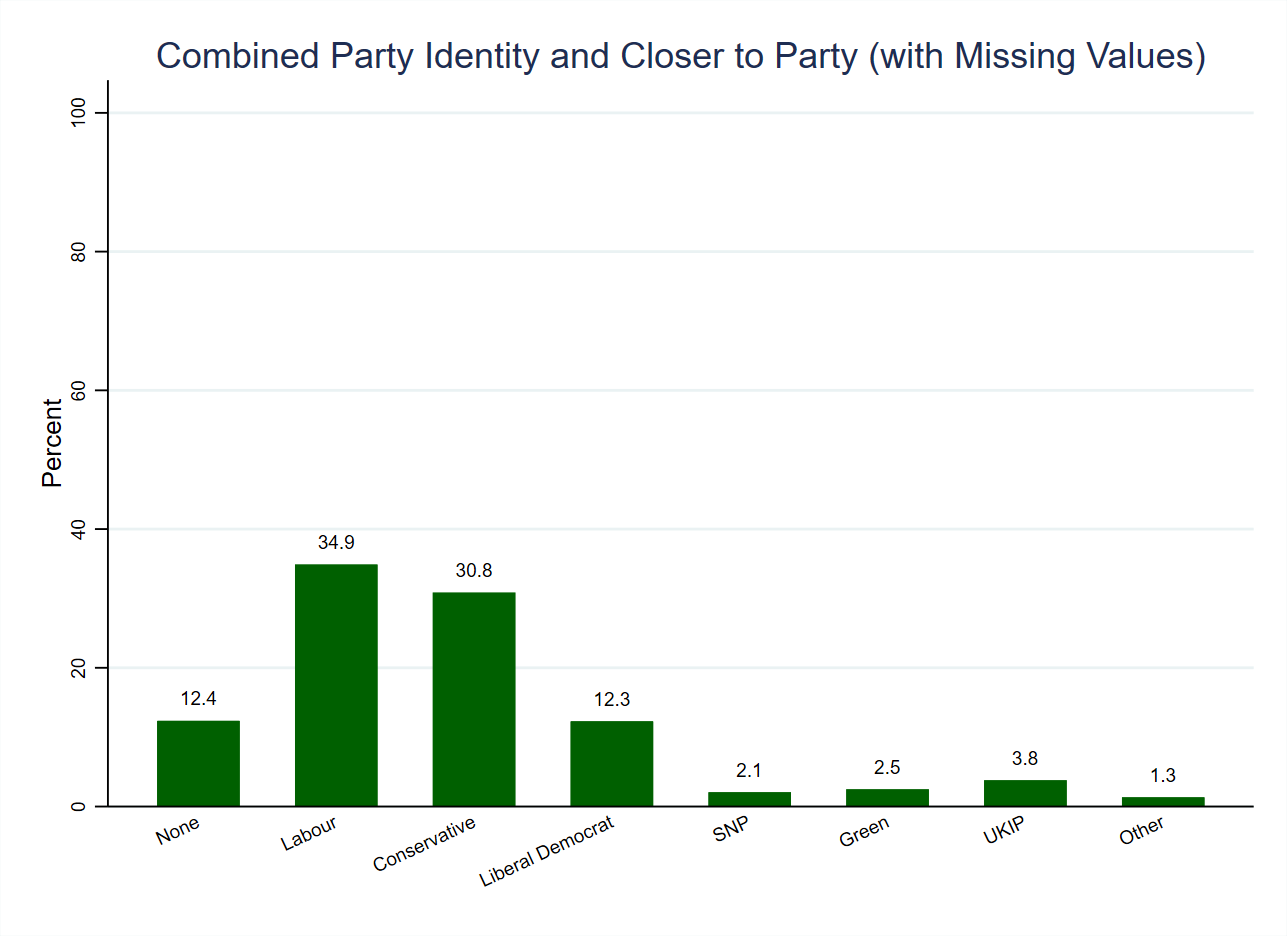
We can combine the answers to the original party identity question with the answers given by those who were prompted to indicate whether they were closer to any party. This gives an overall impression of how many people have some level of psychological attachment to any party. The results of doing so are presented in Figure 2 (below, also using weighted data), and show that each of the parties now has one or two percentage points more people who have an attachment to them (except the SNP, which sees a rise of around half a percentage point). These across-the-board increases come with a concomitant decline in the proportion of people who say that they have no attachment to any party, who now constitute only one in eight people (12.4%).
Overall, then, approaching nine in ten people (87.6%) indicate some level of psychological attachment to a party, and approaching eight in ten (78.0%) favour one of the established UK-wide parties. These figures, however, come with an important and well-rehearsed caveat: surveys of samples drawn from panels of voluntary respondents (even if those samples use quotas to make them representative) tend to display much higher levels of political engagement than those found in the population. In this case, there is good reason to think that there may be a large group of people in the population who do not identify with or feel closer to any of the parties, many of whom may not vote, and who are not disposed to spend their time answering surveys (especially on political topics).
| Variable names | poli_partyid, poli_partycloser |
| Number of cases | 1,405 |
| Number of categories | 9 – 12 |
| Categories to code as missing | 11 (‘Don’t know’) for poli_partyid, plus 11 (‘Don’t know’) and 99 (‘Not asked’) for poli_partycloser |
| Cases to code as missing | 37 – 1,031 |
| Recoded variable name | pe_pid_rmv, pe_pcl_rmv, pe_pidcl_crmv |
| Number of cases | 374 – 1,386 |
| Number of categories | 8 |
| New and old categories | For the new party identity variable (pe_pid_rmv), categories are related to those in the original variable (poli_partyid) as follows: – ‘None’ (0) = ‘None’ (10) – ‘Labour’ (1) = ‘Labour’ (1) – ‘Conservative’ (2) = ‘Conservative’ (2) – ‘Liberal Democrat’ (3) = ‘Liberal Democrat’ (3) – ‘SNP’ (4) = ‘SNP’ (4) – ‘Green’ (5) = ‘Green’ (6) – ‘UKIP’ (6) = ‘UKIP’ (7) – ‘Other’ (7) = ‘Other’ (9) – Missing (.) = ‘Don’t know’ (11) For the new closer to a party variable (pe_pcl_rmv), categories are related to those in the original variable (poli_partycloser) as follows: – ‘None’ (0) = ‘None’ (10) – ‘Labour’ (1) = ‘Labour’ (1) – ‘Conservative’ (2) = ‘Conservative’ (2) – ‘Liberal Democrat’ (3) = ‘Liberal Democrat’ (3) – ‘SNP’ (4) = ‘SNP’ (4) – ‘Green’ (5) = ‘Green’ (6) – ‘UKIP’ (6) = ‘UKIP’ (7) – ‘Other’ (7) = ‘Plaid Cymru’ (5) + ‘BNP’ (8) + ‘Other’ (9) – Missing (.) = ‘Don’t know’ (11) + ‘Not asked’ (99) With the above two new variables coded, the combined variable (pe_pidcl_crmv) was created such that respondents who were ‘None’ (0) on both were coded as ‘None’ (0) on the combined variable, respondents who were one of the parties (or ‘Other’, 7) on either variable were coded as that party on the combined variable, and those who were missing (.) on both variables were coded as missing (.) on the combined variable. |
