Perhaps the form of political participation that has received most attention is voting. This is for good reason; it is consequential in the sense that it clearly affects who governs and the policies that are implemented. From the perspective of political science, it also has the advantage of being a form of participation for which, at least at aggregate level, validated public data on how people behave is available. In other words, election results let us check the accuracy of work that aims to predict electoral outcomes. Voting is also an unusual form of participation because it is relatively low cost and each individual’s vote is extremely unlikely to be decisive in the outcome of the election. Other acts, such as attending public meetings or protesting, require a considerably larger commitment of time and effort on the part of the participant, and also have the potential to offer more immediate and obvious outcomes for that time and effort.
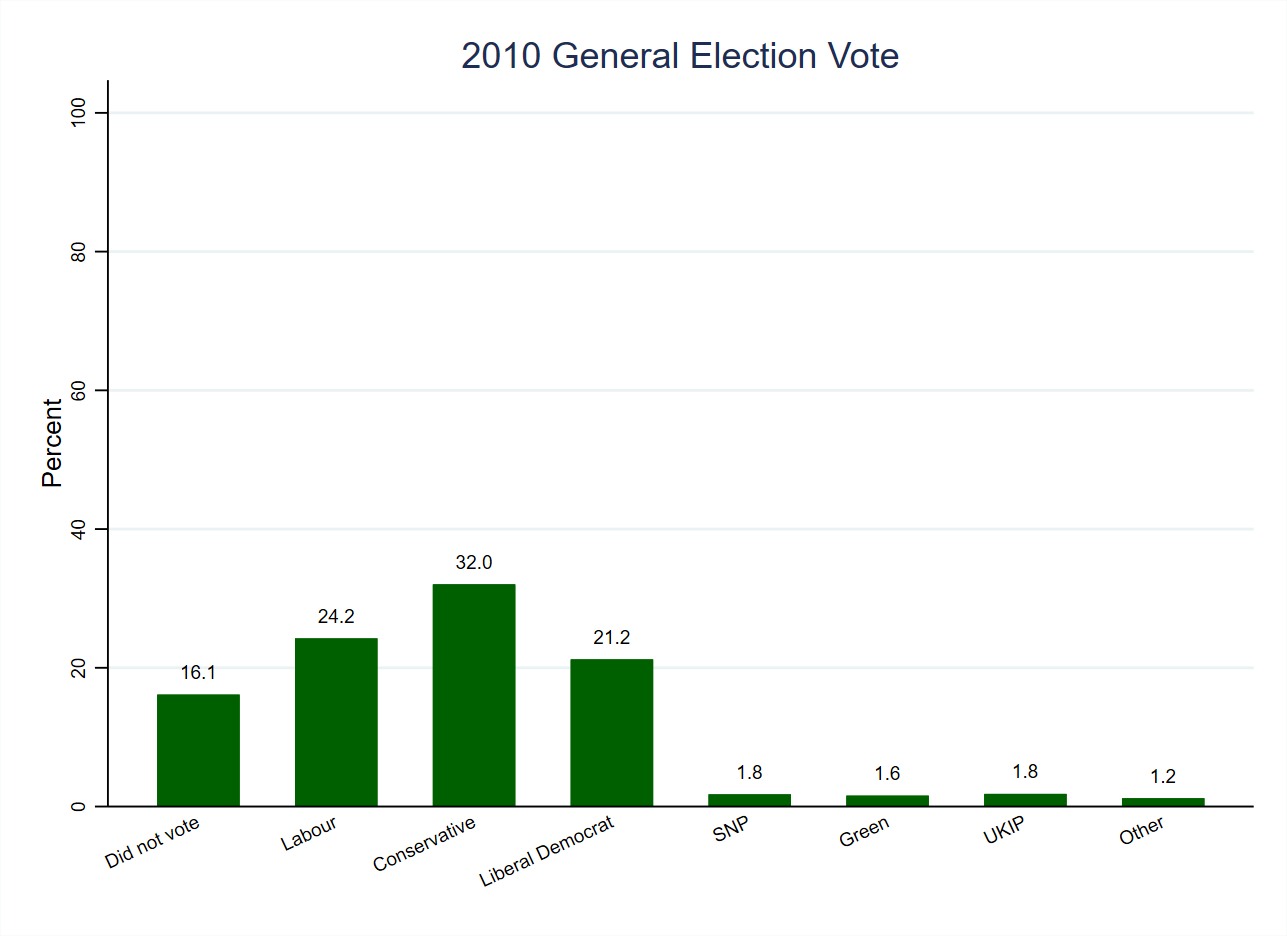
The survey asked people how they had voted in the previous UK general election, which took place in 2010, and their answers are shown in Figure 1 (above, using weighted data). Around a quarter of people (24.2%) voted Labour, almost a third opted for the Conservatives (32.0%), and a further fifth (21.2%) lent their support to the Liberal Democrat, meaning that three quarters of people (74.4%) voted for one of the established UK-wide parties. Between one and two percent of people voted for each of listed smaller parties: SNP (1.8%), Greens (1.6%), UKIP (1.8%), and other parties (1.2%). This means that one in six people (16.2%) in the sample did not vote, which is a clear indicator of how much more politically engaged and active samples of voluntary online respondents are than the general population. The turnout in the 2010 general election was 65.1%, meaning that more than a third of those who were eligible (34.9%) did not vote. This is more than twice the number in our sample, so it is clear that the people who answered the survey are not representative of the public in terms of their political participation.
They are more representative of the population, however, in terms of their decisions about who to support when they vote. If we break down party support amongst those who voted within the sample, the figures are close to those in the population at large:
- 28.9% of the sample who voted supported Labour, whilst 29.0% of the population who voted did so in the 2010 general election.
- 38.2% of the sample who voted supported the Conservatives, which is a couple of percentage points higher than the figure (36.1%) amongst the population who voted.
- 25.3% of the sample who voted did so for the Liberal Democrats, which is also around two percentage points higher than amongst the population who voted (23.0%).
- Support for the smaller parties is over- or under-stated by less than one percentage point in each case: SNP, 2.1% (sample) versus 1.7% (population); Green 1.6% (sample) versus 0.9% (population); UKIP, 2.2% (sample) versus 3.1% (population).
Overall, then, the people who answered the Privilege and Participation Survey are not representative of the population in terms of whether they vote, but are largely representative in terms of who they choose to support when they do vote.
| Variable names | poli_pastvote |
| Number of cases | 1,405 |
| Number of categories | 11 |
| Categories to code as missing | 12 (‘Don’t know’) |
| Cases to code as missing | 36 |
| Recoded variable name | pp_pastvote_rmv |
| Number of cases | 1,369 |
| Number of categories | 7 |
| New and old categories | For the new past vote variable (pp_pastvote_rmv), categories are related to those in the original variable (pp_pastvote_rmv) as follows: – ‘Did not vote’ (0) = ‘Did not vote’ (1) – ‘Labour’ (1) = ‘Labour’ (3) – ‘Conservative’ (2) = ‘Conservative’ (2) – ‘Liberal Democrat’ (3) = ‘Liberal Democrat’ (4) – ‘SNP’ (4) = ‘SNP’ (5) – ‘Green’ (5) = ‘Green’ (8) – ‘UKIP’ (6) = ‘UKIP’ (10) – ‘Other’ (7) = ‘Plaid Cymru’ (6) + ‘BNP’ (7) + ‘Other’ (11) – Missing (.) = ‘Don’t know’ (12) |
