
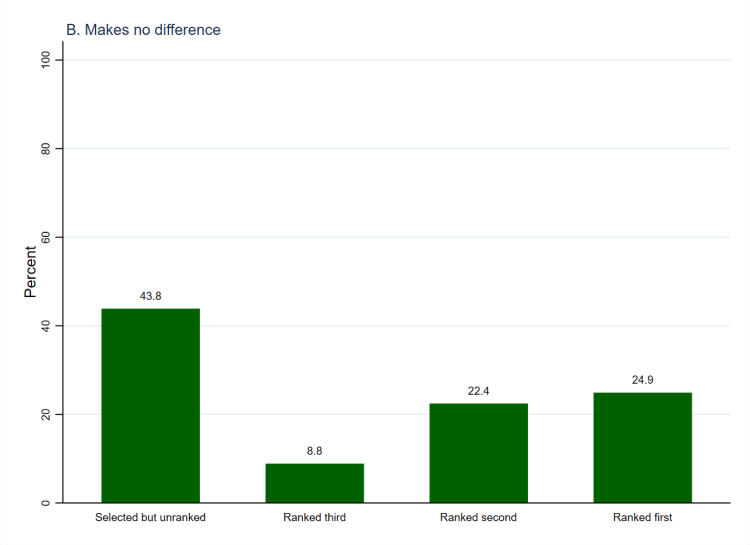
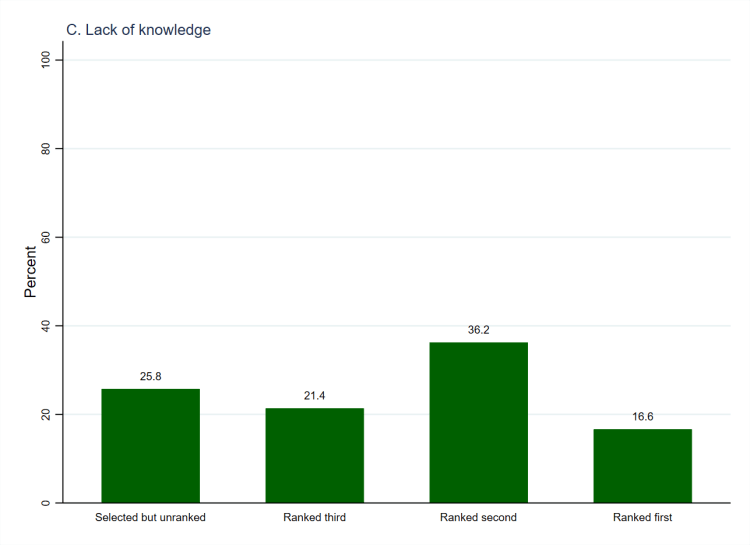
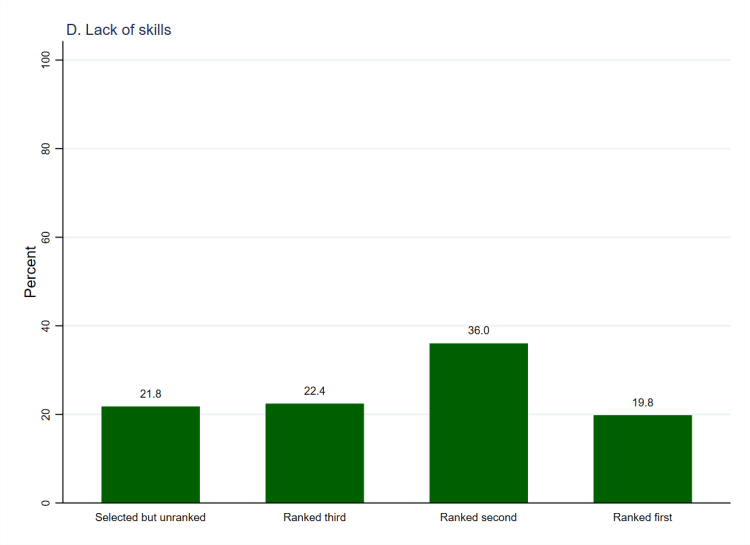
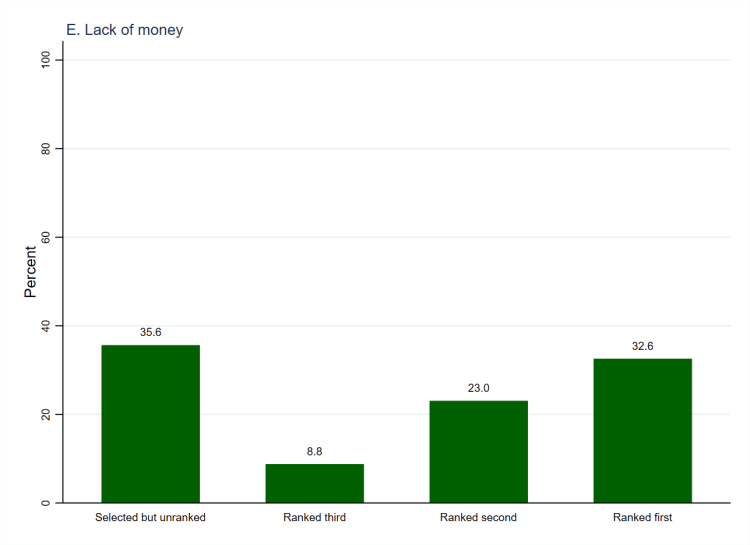

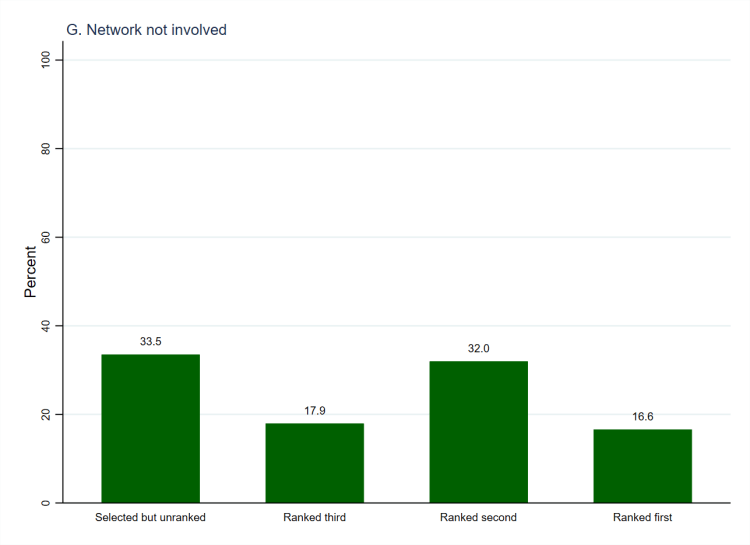
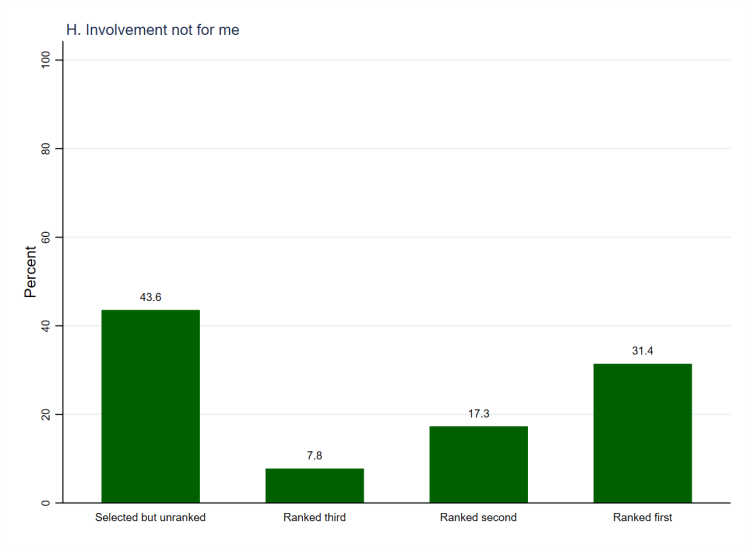
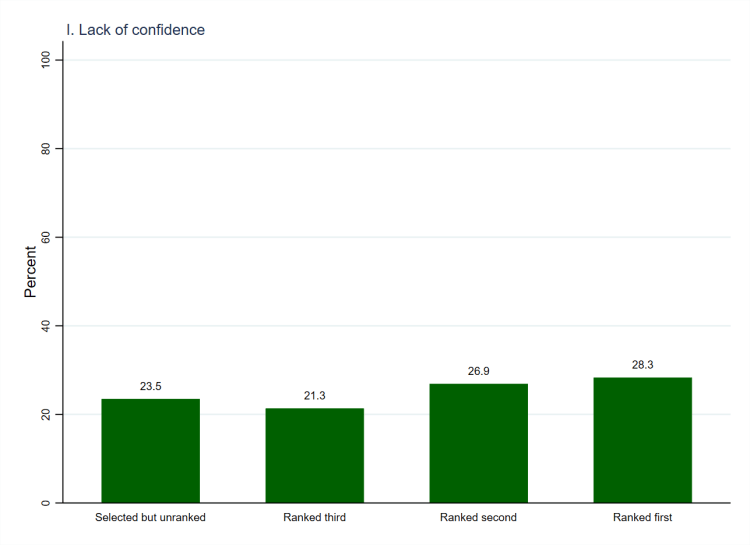
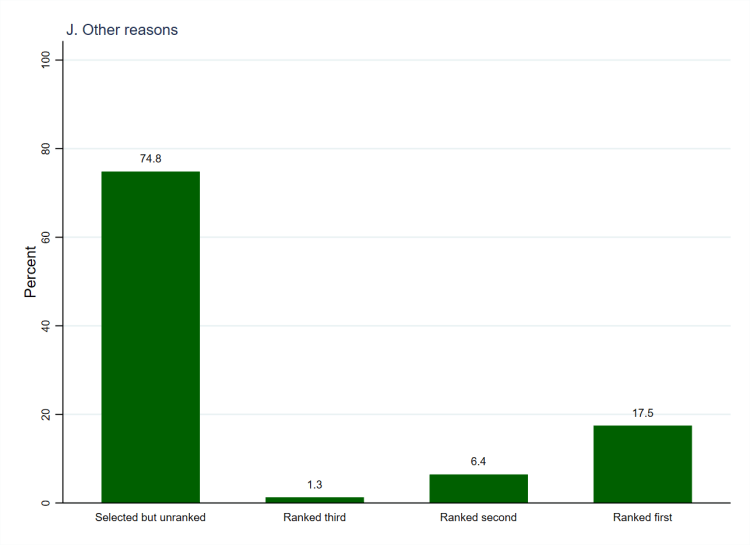
In addition to indicating their reasons for not being involved in political acts or organisations, respondents were also asked to rank the reasons that they selected. Again, these questions were only answered by people who do not do any political acts, get involved in any organisations, or both (n = 505). As Figure 1 (above, using weighted data) shows, a plurality of respondents who selected each reason for non-involvement went on not to rank it in their top three reasons. The exceptions to this are a lack of knowledge (a plurality (36.2%) ranked it second, panel C), lack of skills (a plurality (36.0%) ranked it second, panel D), and lack of confidence (a plurality (28.3%) ranked it first, panel I). A majority of people who selected each reason for non-involvement did rank it as one of their top three reasons (except for Other explanations, for which a large majority (74.8%) selected but did not rank it). So, most people who select each reason for non-involvement think that it is in their top three reasons.
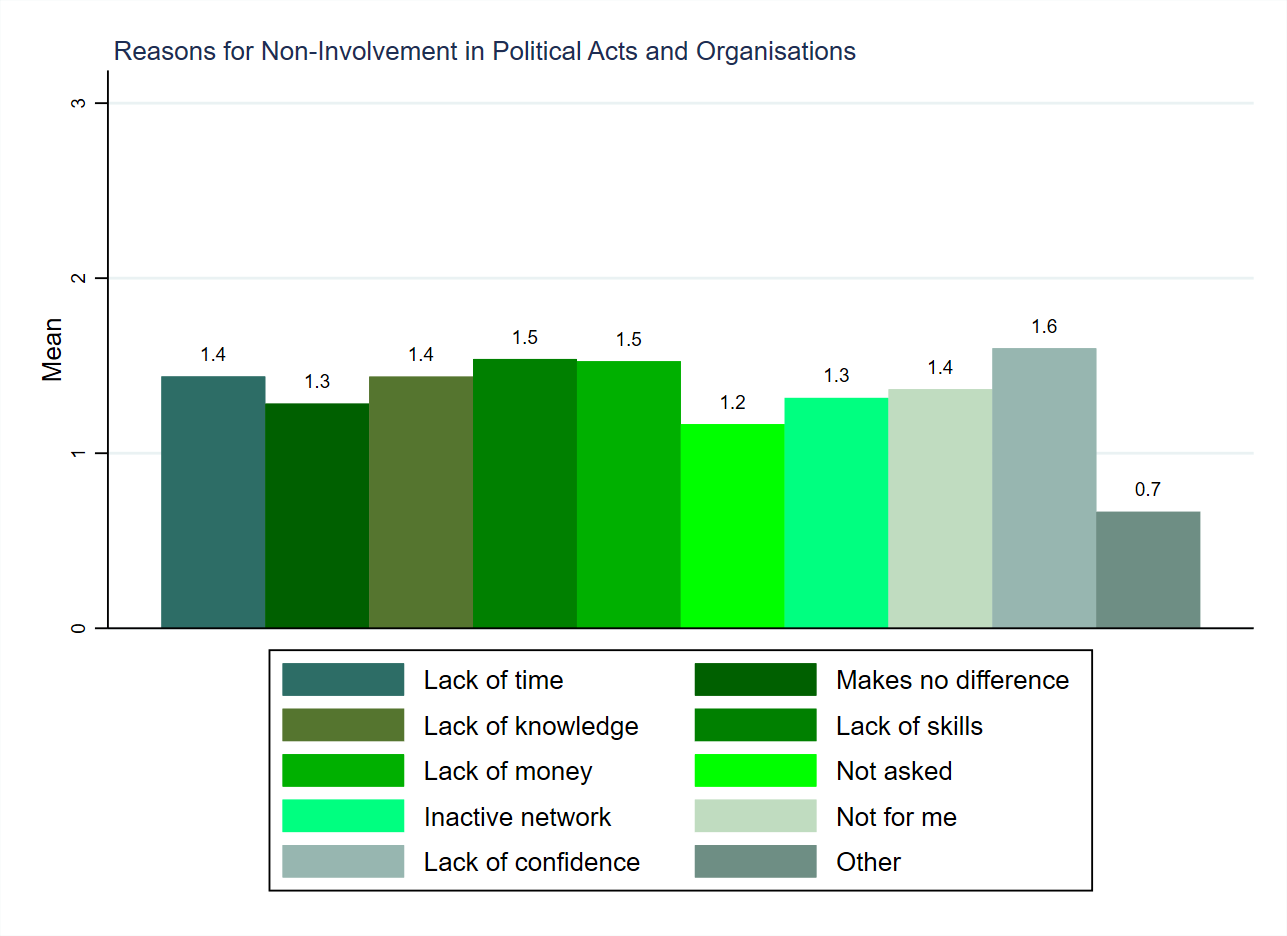
No single reasons stands out as clearly the most top-ranked by those who selected it. In other words, it is not the case that people who select, for instance, lack of time as an explanation for their non-involvement then go on to overwhelmingly rank it as the most important reason (or second, or third most important). This can also be seen in Figure 2 (below, also using weighted data), which presents the mean ranking of each reasons for non-involvement amongst those who selected it.[1] Higher figures equate to higher rankings (e.g. a mean of 3 would indicate that everyone who selected that reason then ranked it as the most important one), and we can see that the distribution is relatively flat. Again, then, there is no stand-out reason that lots of people rank very highly after indicating that it plays a part in explaining their non-involvement. This means that people’s reasons for non-involvement are many and varied, and varied things are important to different people when explaining why they do not get involved in political acts or organisations.
| Variable names | pp_ni_time_r, pp_ni_nodiff_r, pp_ni_knowledge_r, pp_ni_skills_r, pp_ni_money_r, pp_ni_notasked_r, pp_ni_network_r, pp_ni_notforme_r, pp_ni_confidence_r, pp_ni_other_r |
| Number of cases | 505 |
| Number of categories | 5 |
| Categories to code as missing | None |
| Cases to code as missing | None |
[1] The table behind Figure 2 (Table 1A, which is linked to below the figure) includes people who did not select each reason for non-involvement, and thus indicates different figures from those presented in figures 1 and 2.

One thought on “Survey Variable: Ranked Reasons for Non-Involvement”