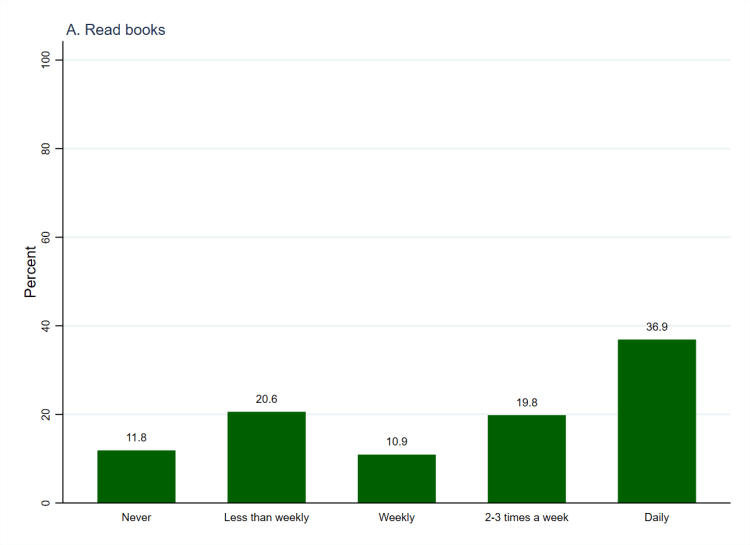
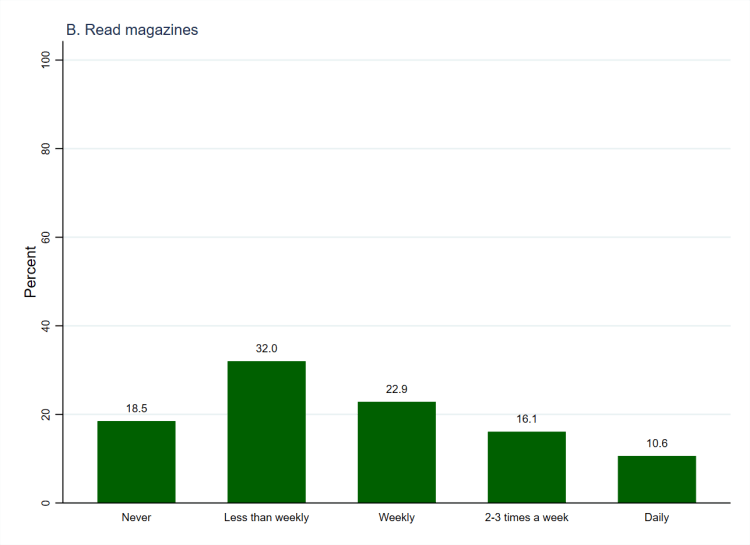
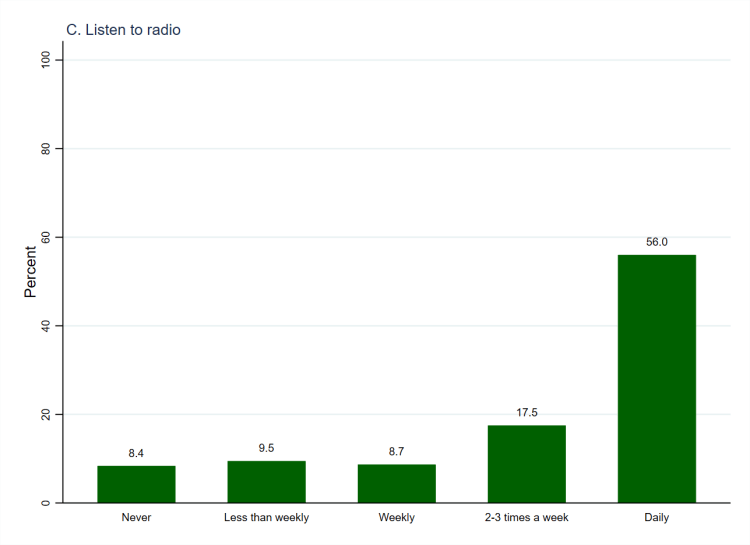

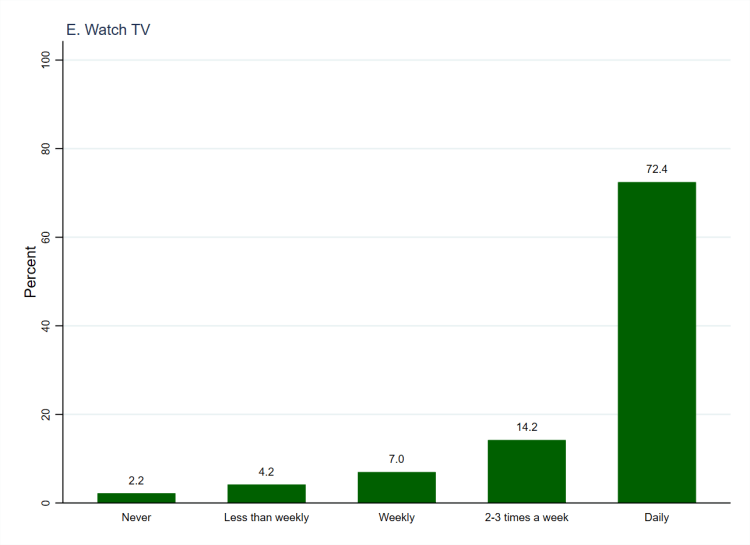
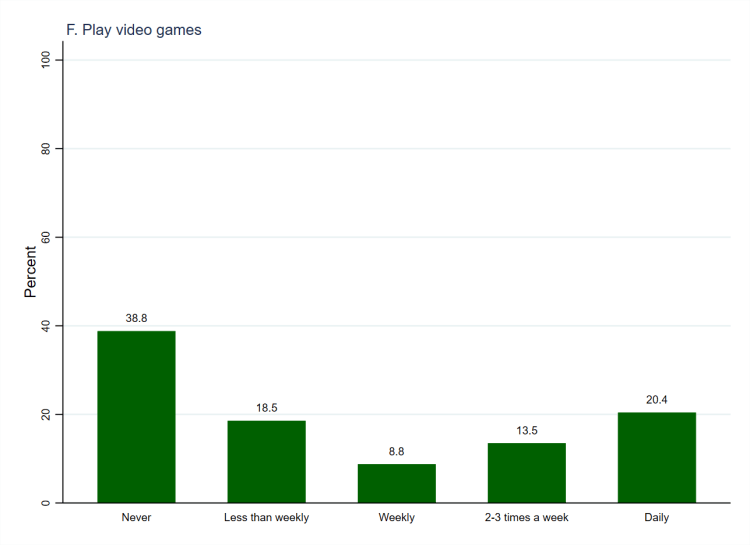
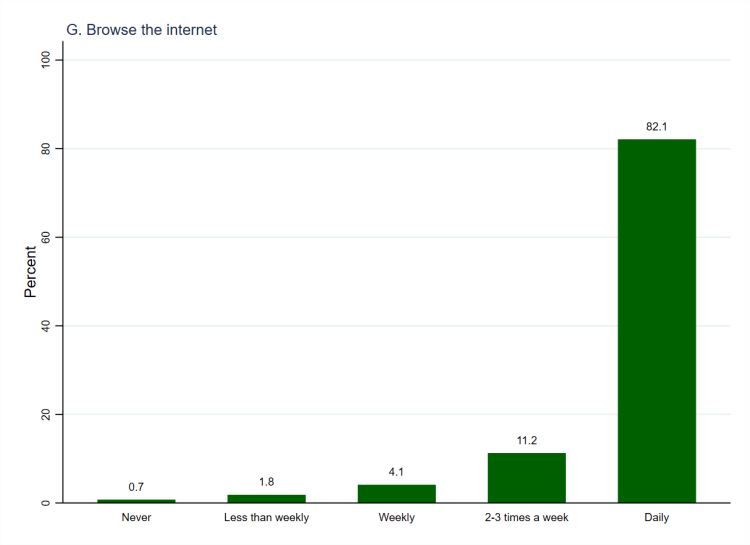
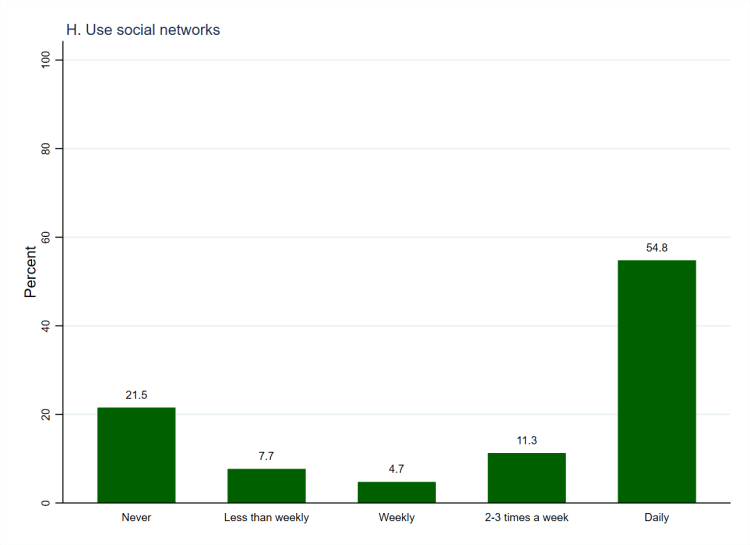
In addition to their activities outside the home, the survey asked how frequently people do various activities at home. Specifically, they were asked how often they read books, read magazines, listen to the radio, listen to music (not on the radio), watch TV (including streaming and DVDs), play video games, browse the internet, and use social networks. As Figure 1 (above, using weighted data) shows, browsing the internet (panel G) is the most frequently undertaken activity.[1] Four in five people (82.1%) do so daily, and this figure is unsurprising given that the survey was fielded to members of an online panel of respondents. The most popular non-online activity is watching TV (panel E), which is done daily by approaching three quarters of people (72.4%). Both listening to the radio (panel C, 56.0%) and using social networks (panel H, 54.8%) are done daily by comfortably more than half of people. By contrast, the least frequently undertaken activity is playing video games (panel F), which almost two in five people (38.8%) never do.
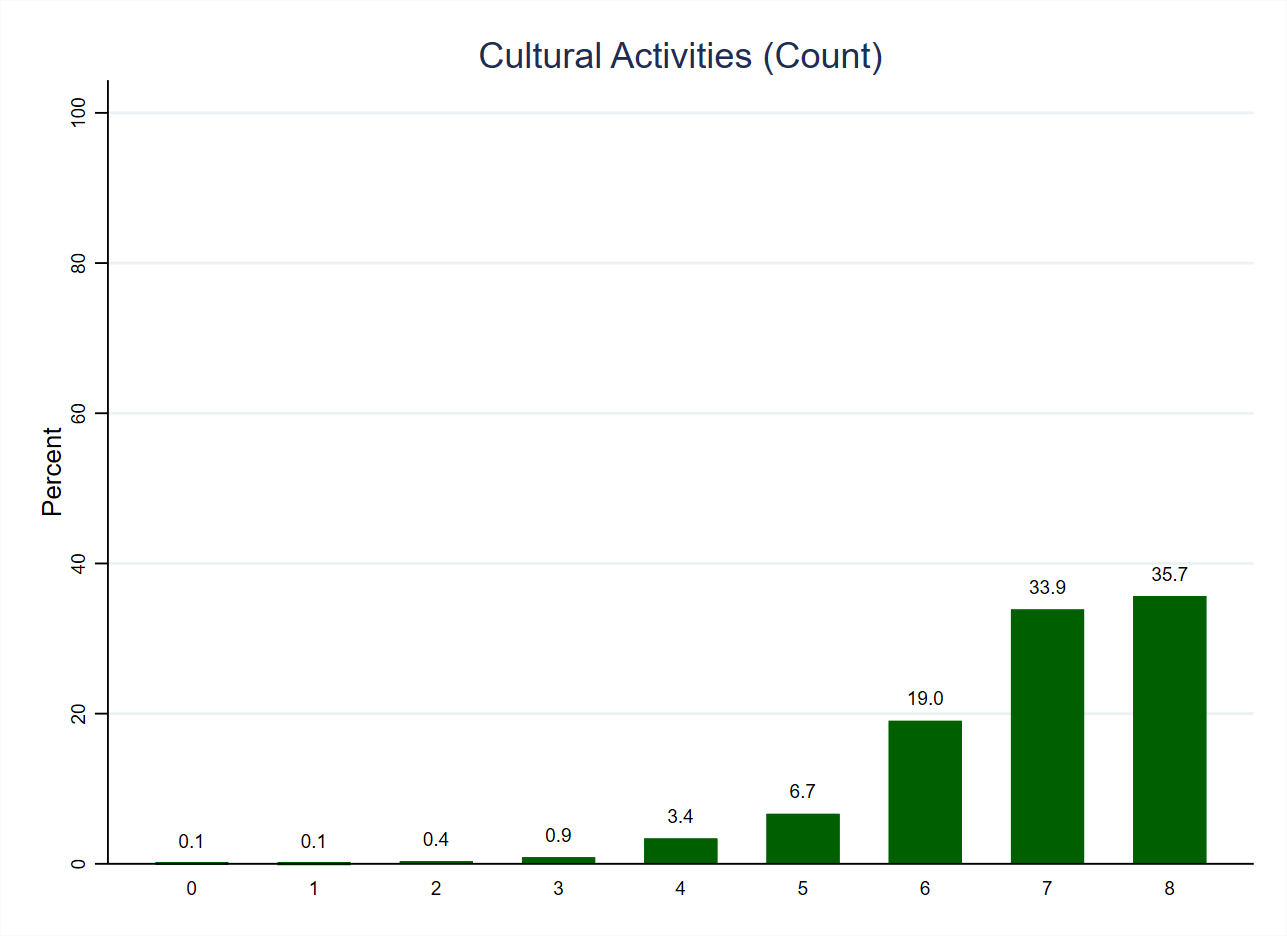
Patterns of ‘legitimate’ cultural activities (held in high regard and seen as worthy) cannot be discerned from this question because we do not know what kinds of things people watch, listen to, or read. In terms of legitimate cultural capital, someone who watched art-house films two or three times a week would have a rather different profile from someone who watched reality television every night, and someone who did both would be distinct again. Despite this limitation in the question, we can still look at how numerous people’s cultural activities are.[2] Figure 2 (below, also using weighted data) does this, and shows that almost nine in ten people (88.6%) do six or more of the activities at least occasionally. This means that most people undertake numerous cultural activities when they are at home, and those with more restricted activities (i.e., who do five or fewer activities) are in a very small minority (11.4%). This pattern is similar to the pattern for cultural activities outside the home, which is skewed towards greater numbers of activities but has its peak closer to the middle of the range. These two patterns are distinct from the patterns of numbers of cuisines eaten and restaurant types visited, which are skewed towards lower end of the range. Again, this indicates that people are willing to do a greater number of cultural activities, at least occasionally, but less willing (or able) to venture to numerous culinary pastures.[3]
| Variable names | cc_int_book_ir, cc_int_mags_ir, cc_int_radio_ir, cc_int_music_ir, cc_int_tv_ir, cc_int_games_ir, cc_int_web_ir, cc_int_socnet_ir |
| Number of cases | 1,405 |
| Number of categories | 5 |
| Categories to code as missing | None |
| Cases to code as missing | None |
| Recoded variable name | cc_int_count |
| Number of cases | 1,405 |
| Number of categories | 9 |
| New and old categories | Categories 1 (‘Less than weekly’), 2 (‘Weekly’), 3 (‘2-3 times a week’), and 4 (‘Daily’) on each of the original variables were counted as 1 (i.e. indicating that the form of cultural activity has been undertaken at least occasionally), with category 0 (‘Never’) counted as zero. As such, 0 on the new variable indicates that none of the cultural activities are ever done whilst 8 indicates that all of them are done at least occasionally. |
[2] We might be able to examine this by also considering the genres of music, radio stations, and television stations that people prefer, which are indicated in subsequent variables.
[3] This may relate to the question format; it may be that people are less likely to indicate that they never do something when asked about frequency than when they are asked to simply indicate whether or not they do it.

One thought on “Survey Variable: Cultural Activities in the Home”