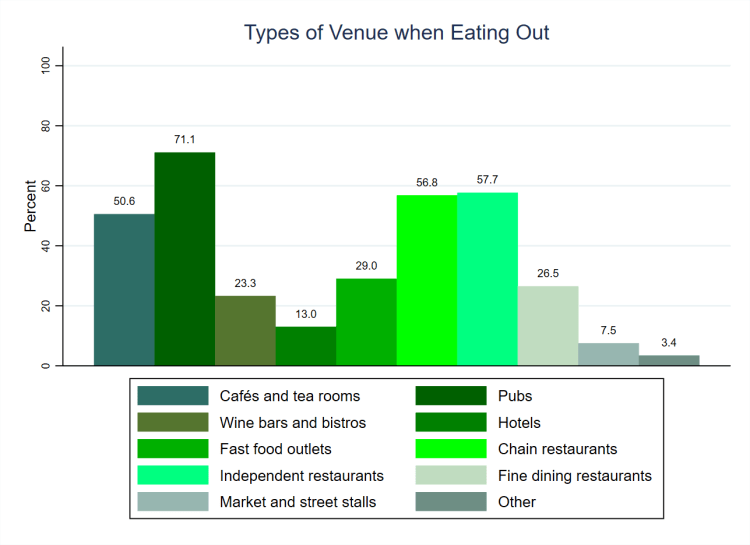
It is not just people’s cultural activities that are of interest, but also their tastes. These might relate to film, music or (more literally) cuisine, amongst other things. Respondents who indicated that they eat out with friends at least occasionally were asked about the kinds of places that they go. As Figure 1 (above, using weighted data) shows, pubs are the most popular venues to eat at and seven in ten people (71.1%) indicate that they do so. There is then a notable gap before the two next most popular venues: independent and chain restaurants, which are each visited by roughly three fifths of respondents (57.7% and 56.8%). The only other venues that more than half of people (only just: 50.6%) visit are cafés and tea rooms.
The least popular venues are market and street stalls,[1] which fewer than one in every thirteen people (7.5%) ever visit. These are followed by hotels (13.0% visit them to eat), wine bars and bistros (23.3%), and fine dining restaurants (26.5%). This means that fast food outlets are the middle option in terms of popularity, with around one in three people (29.0%) indicating that they eat at them. As with cultural activities, there is no clear pattern in which ‘legitimate’ venues (which are held in high esteem and seen as worthy), such as fine dining restaurants and bistros, are the least popular eateries. Indeed, they are both quite similar to fast food outlets in terms of their popularity, though it remains to be seen whether the same people go to both.
An obvious explanation for the pattern of popularity in eateries is that the most widespread kinds are the most popular. Pubs, restaurants, and cafés can be found on high streets throughout the country, but this is less the case for bistros, fine dining restaurants, and market stalls (though the latter are increasingly prevalent). Fast food outlets provide an exception to this trend, in the sense that they are widespread but not very popular. This may simply be because people don’t go to them when eating out (preferring to get takeaway), or because there is some stigma associated with admitting that they are visited.[2]
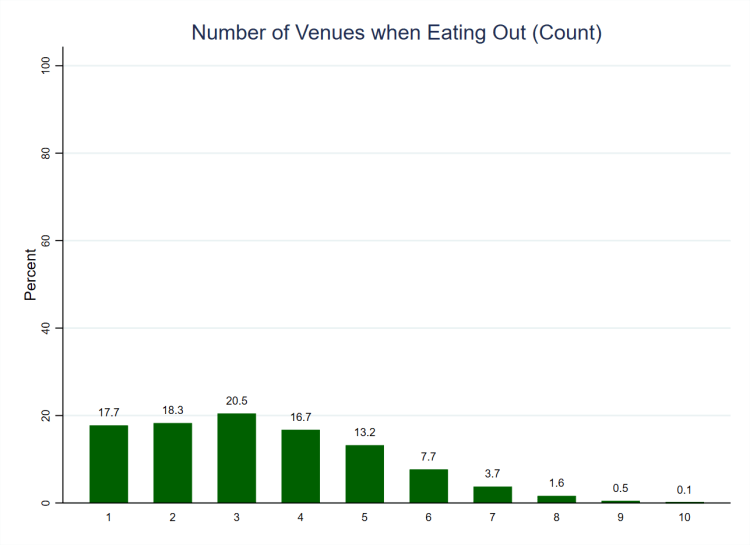
We can also look at how many types of venue people go to, as shown in Figure 2 (below, also using weighted data). The first half of the distribution is remarkably flat, and comfortably more than four in five people (86.4%) indicate that they eat at between one and five different types of venue. The modal category is three types (20.5% of people fall into this group), and there is a particularly large drop-off above five types of venue. This distribution is rather different from the distribution of the number of cultural activities that people undertake. In that case, the bulk of people were placed at the higher end of the scale, indicating that they did more than half of the activities at least occasionally. By contrast, whilst people do visit multiple types of eatery, their tastes in this area are more constrained than their wider cultural activities are.
| Variable names | cc_eov_cafetea_bmv, cc_eov_pub_bmv, cc_eov_winebist_bmv, cc_eov_hotel_bmv, cc_eov_fastfood_bmv, cc_eov_chainrest_bmv, cc_eov_indrest_bmv, cc_eov_finedine_bmv, cc_eov_marketss_bmv, cc_eov_other_bmv |
| Number of cases | 1,328 |
| Number of categories | 2 |
| Categories to code as missing | None |
| Cases to code as missing | None |
| Recoded variable name | cc_eov_count |
| Number of cases | 1,328 |
| Number of categories | 10 |
| New and old categories | Category 1 (‘Yes’) on each of the original variables was counted as 1 (i.e. indicating that the type of eatery is visited), with category 0 (‘No’) counted as zero. As such, 1 on the new variable indicates that only one type of venue is visited when eating out (respondents who don’t eat out were not asked this question, which is why there are no zero (0) answers), whilst 10 indicates that all of the venues are visited at least occasionally. |
[1] Except for the ‘Other’ category.
[2] This is less likely because the survey was online, meaning that there was no social pressure associated with the presence of an interviewer.

3 thoughts on “Survey Variable: Eating Out Venues”