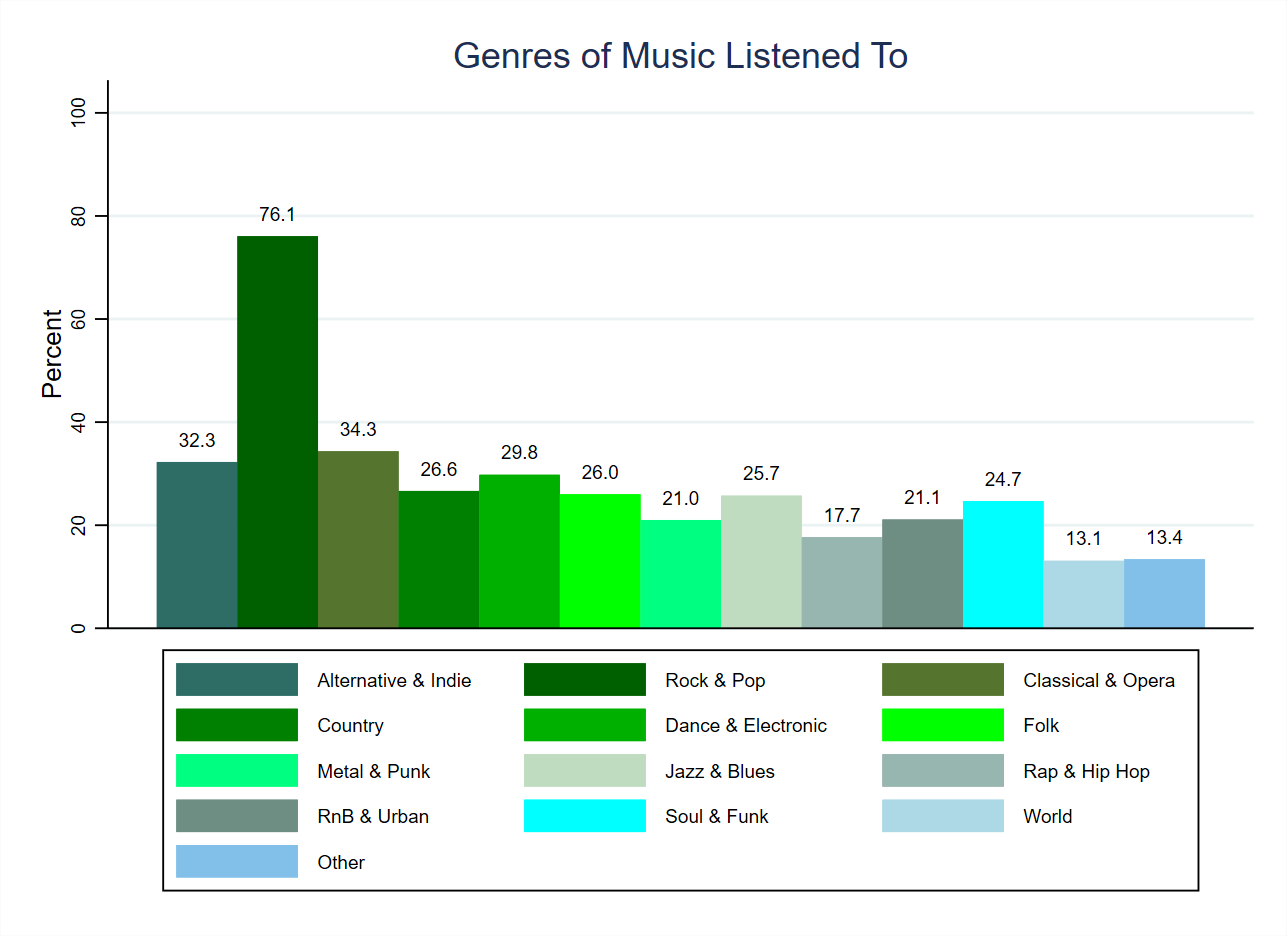
Beyond the types of places that they eat and their preferred cuisines, the survey also asked about people’s musical tastes. This is part of the survey’s wider focus on cultural habits and tastes. As Figure 1 (above, using weighted data) shows, and unlike culinary tastes, there is one genre of music that stands out as by far the most popular: more than three quarters of people (76.1%) listen to rock and pop music. This is more than twice the percentage who listen to the next most popular genre: classical and opera music (listened to by 34.3%). Indeed, almost all of the genres are listened to by between roughly a fifth and a third of people. At the opposite end of this relatively flat distribution from classical and opera music is rap and hip hop music (listened to by 17.7%), and the only genres falling notable below these levels are world music (13.1%) and other music (13.4%).
From the perspective of Pierre Bourdieu’s differentiation between legitimate (worthy, held in high esteem) and popular (widespread, seen as less valuable) cultural capital, there are some things that we would expect and others that we would not. The clear status of rock and pop as the most popular genre might be expected (the clue’s in the name) but the status of classical and opera music as the second most popular genre might not. The lack of popularity of other genres that are often not viewed as legitimate, such as rap and hip hop, might reflect their status as part of ’emerging’ cultural capital amongst particular sub-cultures. It remains to be seen whether there are any genres that are particularly opposed, in the sense that people who listen to one are very unlikely to listen to the other.
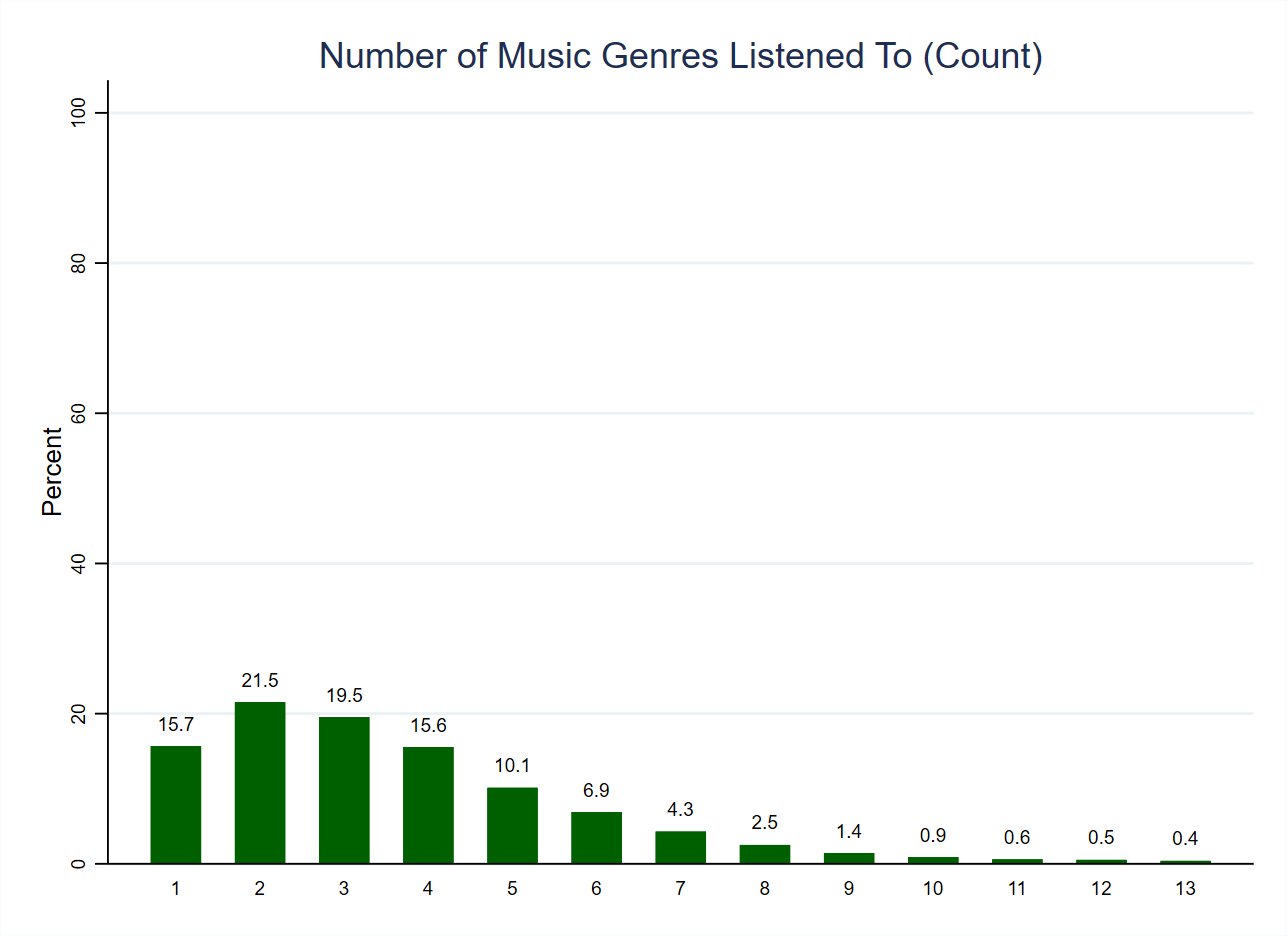
However, we can look at how many genres people listen to, which will indicate how much potential there is for distinct preferences for different genres. As Figure 2 (below, also using weighted data) shows, comfortably more than half of people (56.7%) listen to three or fewer genres. Further, four in five people (82.4%) listen to five or fewer genres, and this allows for the possibility that some genres are not listened to by the same people. It is also worth noting that this distribution is skewed towards lower numbers, as is the case with preferred eateries and cuisines. This may, again, suggest that people are more willing to indicate that they don’t engage with certain types of culture (in this case, musical genres) when given binary ‘Yes’ or ‘No’ questions than when they are asked about the frequency with which they do things (as was the case for cultural activities outside and in the home).
| Variable names | cc_mg_altindie_bmv, cc_mg_rockpop_bmv, cc_mg_classopera_bmv, cc_mg_country_bmv, cc_mg_dancelec_bmv, cc_mg_folk_bmv, cc_mg_metalpunk_bmv, cc_mg_jazzblues_bmv, cc_mg_raphh_bmv, cc_mg_rnburban_bmv, cc_mg_soulfunk_bmv, cc_mg_worldmusic_bmv, cc_mg_other_bmv |
| Number of cases | 1,252 |
| Number of categories | 2 |
| Categories to code as missing | None |
| Cases to code as missing | None |
| Recoded variable name | cc_mg_count |
| Number of cases | 1,252 |
| Number of categories | 13 |
| New and old categories | Category 1 (‘Yes’) on each of the original variables was counted as 1 (i.e. indicating that the genre of music is listened to), with category 0 (‘No’) counted as zero. As such, 1 on the new variable indicates that only one genre of music is listened to (respondents who don’t listen to music were not asked this question, which is why there are no zero (0) answers), whilst 13 indicates that all of the genres are listened to at least occasionally. |

2 thoughts on “Survey Variable: Music Genres Listened To”