

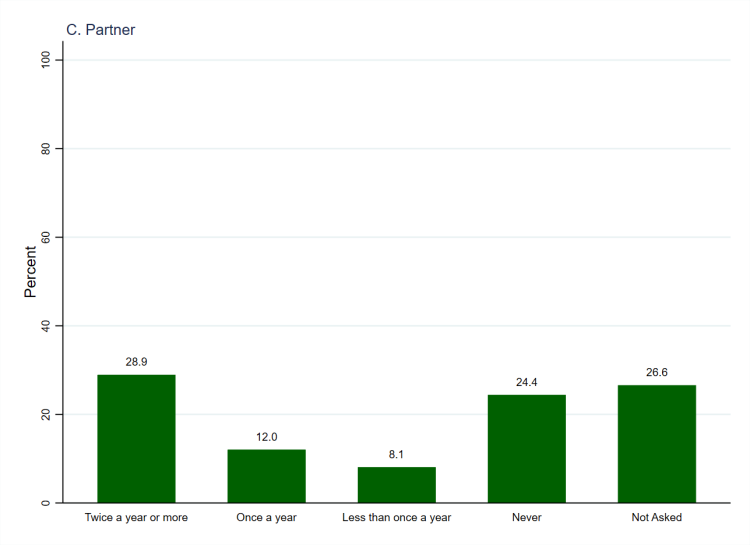


Holidays sit at the intersection of economic, social, and cultural capital: they often represent a major annual expenditure, are undertaken with close social networks (family and friends), and reflect cultural tastes and habits. Before being asked about what they do when they are away, respondents were asked how often they go on holiday (including weekend breaks) with different groups. As Figure 1 (above, using weighted data) shows, going on holidaying with a partner (panel C) is the most popular way of getting away, and more than a quarter of people (28.9%) do so twice a year or more often.[1] This is almost three times more people than go away twice a year or more with family (10.1%, panel D), which is the next most popular group to go away with. These are also the two most popular sets of people to ever go on holiday with: three fifths (60.4%) go on holiday with family at least sometimes and almost half (49.0%) do so with their partners. The least popular option is going with one’s partner and children (panel B) as opposed to family more widely, which is done just over a fifth (21.3%) of people. In between the most and least popular options are going on holiday with friends (done with any regularity by 46.4%, panel E) and alone (done with any regularity by 27.1%, panel A).
We can also look at how many groups people go on holiday with at each level of frequency, as shown in Figure 2 (below, also using weighted data).[2] The patterns when we look at each group who people go on holiday with (Figure 1) generally show a growing percentage as the frequency decreases. This is reflected in the opposite pattern when we look at the number of groups holidayed with at each frequency (Figure 2): in all but one case (Never, panel D), the largest percentage is associated with zero groups and the percentages fall as the number of groups holidayed with increases. Together, figures 1 and 2 paint a picture of holidays as once or twice a year events with close or wider family, and occasionally friends. However, we may wish to take additional caution with these results because of the ambiguity of the distinction between the groups that are asked about. We can see from Figure 1 that the options relating to a partner and children (panel B) and a partner (panel C) were only shown to some respondents (hence the ‘Not asked’ option), and this was based on how many children they have in their household (i.e., they were not asked about holidaying with children if they have no children at home). However, it is possible that people have adult children who they go on holiday with, and they may have indicated this in their answers to the family option. This exposes the ambiguity of the distinction between family and a partner or partner and children, which might have been resolved if ‘extended family’ had been referred to instead. Thus, our frequent uncertainty about precisely what respondents have in mind when they answer survey questions might be especially acute given the blurring of three of the categories asked about in this question.


| Variable names | cc_hf_own, cc_hf_partchil, cc_hf_partner, cc_hf_family, cc_hf_friends |
| Number of cases | 1,405 |
| Number of categories | 4/5 |
| Categories to code as missing | None |
| Cases to code as missing | None |
| Recoded variable name | cc_hf_gtwice, cc_hf_gonce, cc_hf_gless, cc_hf_gnever |
| Number of cases | 1,405 |
| Number of categories | 5 |
| New and old categories | Category 1 (‘Twice a year or more’), was counted as 1 for each group asked about, and all other categories counted as zero, with the total (ranging from 0 to 4) indicating how many groups are holidayed with twice a year or more often (cc_hf_gtwice). This process was repeated for each frequency of holidaying to give separate variables indicating how many groups are holidayed with at each frequency. |

One thought on “Survey Variable: Holiday Frequency”