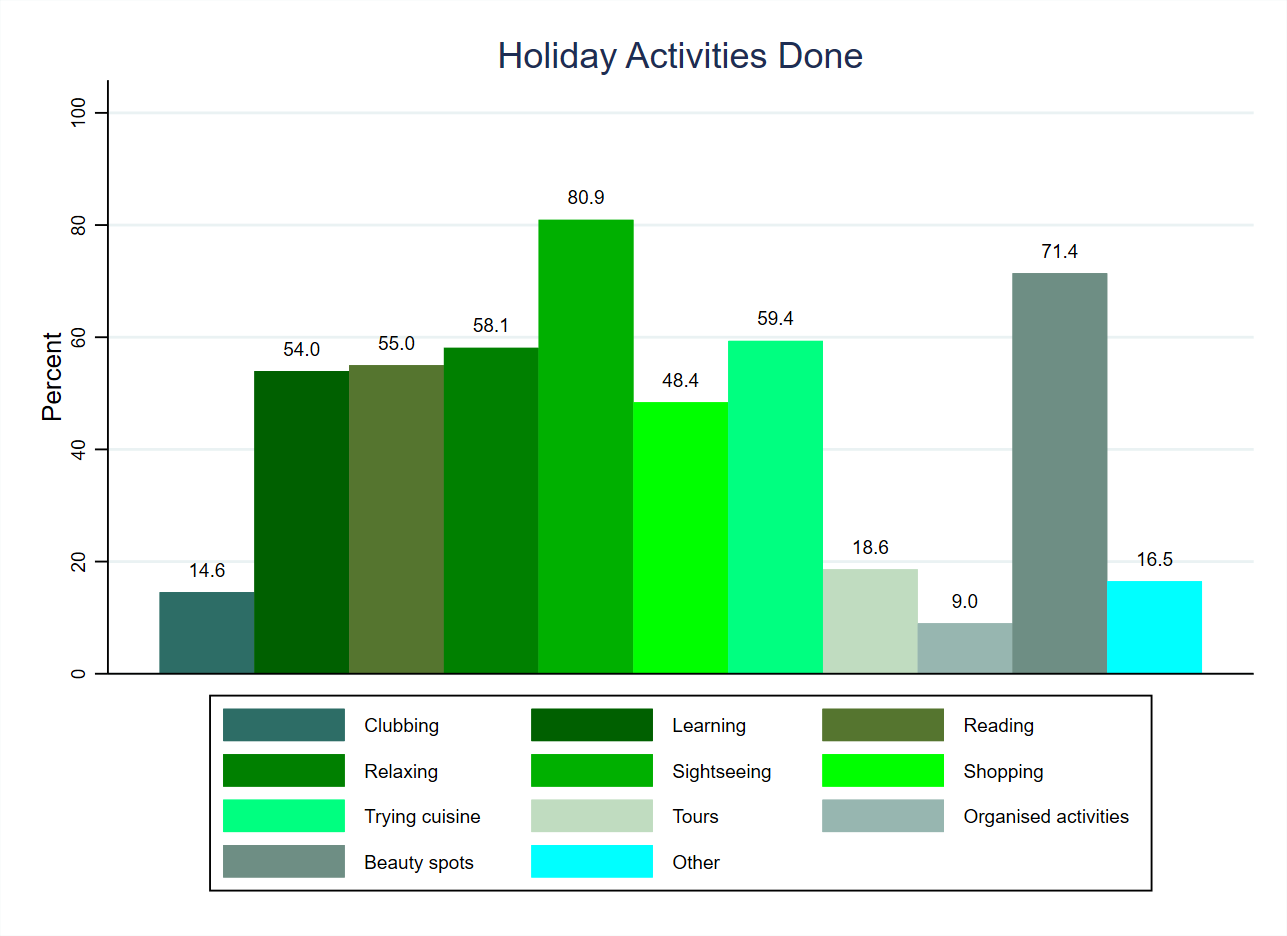
Having asked about how often they go on holiday with various groups, the survey also asked respondents about the kinds of things they do on holiday. As Figure 1 (above, using weighted data) shows, there are two particularly popular holiday pastimes: sightseeing is done by four in five people (80.9%) and visiting beauty spots is done by seven in ten (71.4%). After these, a series of activities are done by between six in ten and half of people: trying local cuisine (59.4%), relaxing by doing as little as possible (58.1%), reading (55.0%), learning about local history or culture (54.0%), and shopping (48.4%). At the other end of the popularity spectrum, participation in organised activities (such as hikes, treks, sports, or performances) is undertaken by fewer than one in ten people (9.0%). Further, both clubbing and going on tours are done by fewer than one in five people (14.6% and 18.6% respectively). Overall, most of the eleven activities, whether or not they symbolise ‘legitimate’ (held in high regard, seen as valuable) cultural capital (such as learning about local history and culture), are popular and the three unpopular activities (tours, clubbing, and organised activities) are clear exceptions to this tendency.
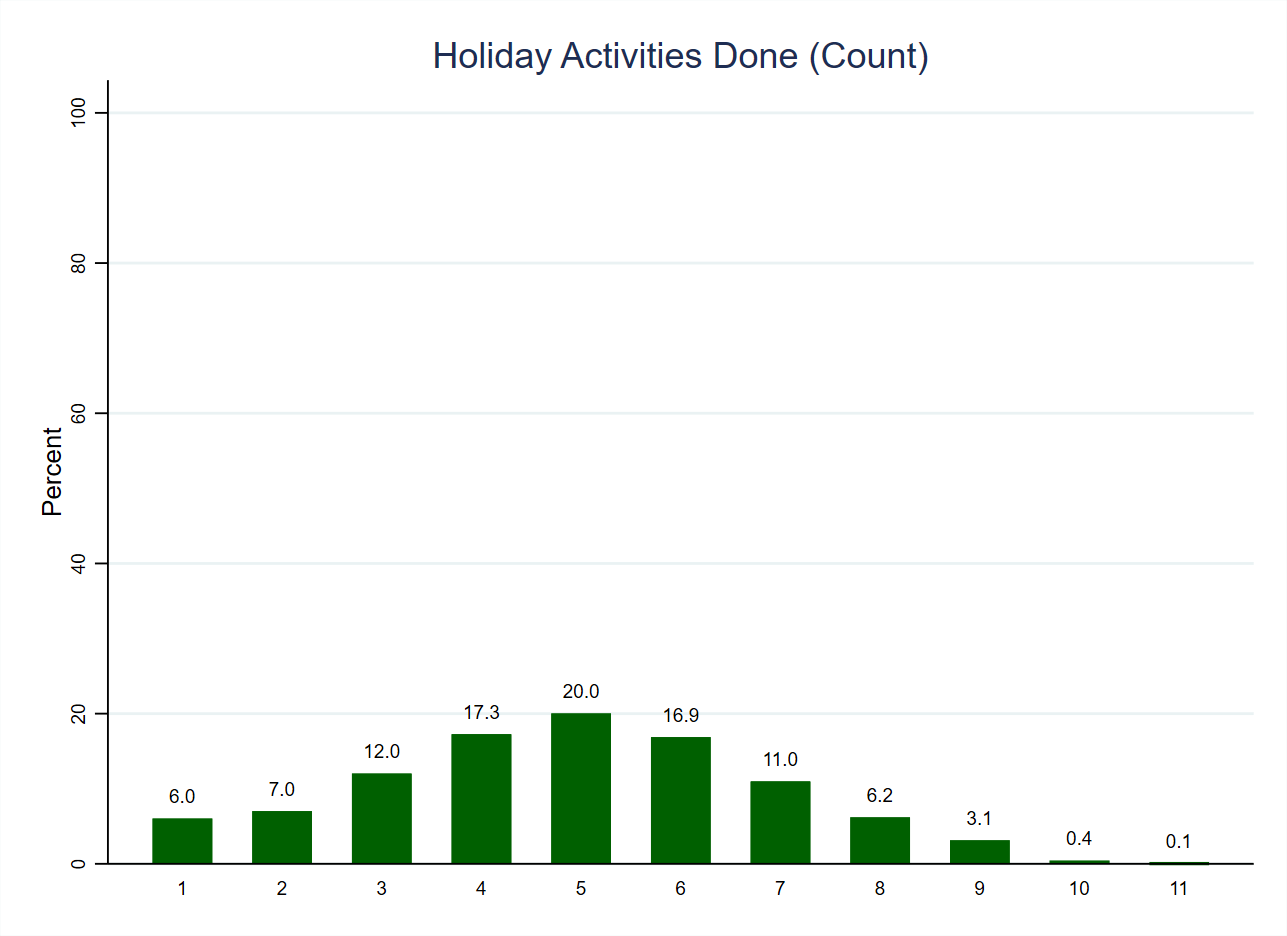
As with types of music listened to and types of film watched, we can also look at how many different activities people do when on holiday. Figure 2 (below, also using weighted data) shows that more than half (54.2%) do between 4 and 6 activities, with a roughly normal distribution around 5. Slightly more people (42.3%) do lower numbers of activities (below 5) than higher numbers (above 5, done by 37.7%) but people generally do quite a lot of activities. As with music and film, however, we cannot tell how often people do them, so it might be the case that some are far more popular than others in these terms (for instance, people might spend much more time relaxing by doing as little as possible than they spend sightseeing). Finally, and unlike cultural activities outside the home, the fact that most respondents are at the lower end of the scale may again indicate their greater willingness to say that they never do things when asked a simple ‘Yes’ or ‘No’ question than when asked one about frequency of activities.
| Variable names | cc_ha_clubbing_bmv, cc_ha_learning_bmv, cc_ha_reading_bmv, cc_ha_relaxing_bmv, cc_ha_sightseeing_bmv, cc_ha_shopping_bmv, cc_ha_cuisine_bmv, cc_ha_tours_bmv, cc_ha_activities_bmv, cc_ha_beautyspots_bmv, cc_ha_other_bmv |
| Number of cases | 1,280 |
| Number of categories | 2 |
| Categories to code as missing | None |
| Cases to code as missing | None |
| Recoded variable name | cc_ha_count |
| Number of cases | 1,280 |
| Number of categories | 11 |
| New and old categories | Category 1 (‘Yes’) on each of the original variables was counted as 1 (i.e. indicating that the activity is done on holiday), with category 0 (‘No’) counted as zero. As such, 1 on the new variable indicates that only one activity is done on holiday (respondents who don’t go on holiday were not asked this question, which is why there are no zero (0) answers), whilst 11 indicates that all of the activities are done at least occasionally when on holiday. |
